Category: Learn to Trade

How to Analyze Trends With Moving Average Ribbons

How to Analyze Trends With Moving Average Ribbons

For many traders, a single Moving Average (MA) line provides limited information. The Moving Average Ribbon solves this problem by using a cluster of MAs to create a visual wave that instantly reveals the strength, momentum, and potential reversal points

How to Use Moving Average Envelopes

How to Use Moving Average Envelopes

Trading professionals utilize Moving Average Envelopes (MAE), a potent technical analysis tool, to spot trends, possible reversals, and overbought or oversold situations in financial markets. These envelopes assist traders in identifying critical price levels for starting or quitting trades by

How to Use Moving Averages as Dynamic Support and Resistance Levels

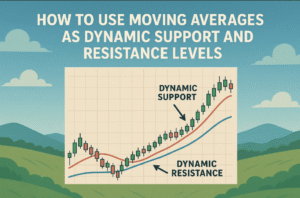
How to Use Moving Averages as Dynamic Support and Resistance Levels

Traders utilize moving averages (MAs), one of the most flexible tools in technical analysis, to find trends, entry locations, and, more recently, dynamic support and resistance levels. Static support and resistance levels are set at particular price points, but moving

How to Enter Trades Using Moving Average Crossovers

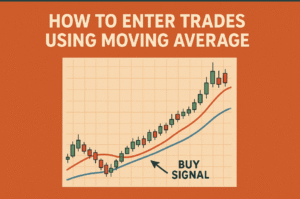
How to Enter Trades Using Moving Average Crossovers

Moving average crossovers are a cornerstone of technical analysis, widely used by traders to identify potential entry and exit points in financial markets. This powerful yet simple strategy leverages the interaction of two moving averages to signal trends, helping traders

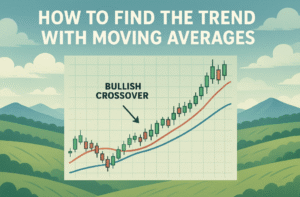
How to Find the Trend with Moving Averages

How to Find the Trend with Moving Averages

Finding trends using moving averages is a popular method in data analysis, particularly in finance, economics, and time-series analysis. Moving averages smooth out data fluctuations to reveal underlying trends. This guide will show you how to use a single Moving

Simple vs. Exponential Moving Averages What is the Difference

Simple vs. Exponential Moving Averages: What is the Difference?

The Moving Average is the foundation of technical analysis. Almost every indicator, from the MACD to Bollinger Bands, relies on the concept of averaging past price data to identify a trend. However, when you open your trading platform, you’ll immediately

Exponential Moving Average (EMA) Beginner's Guide

Exponential Moving Average (EMA): Beginner’s Guide

The Exponential Moving Average (EMA) is one of the most popular and powerful tools in a technical trader’s arsenal. Like the Simple Moving Average (SMA), the EMA is designed to smooth out price action and help identify the true direction

Simple Moving Average (SMA) Comprehensive Overview

Simple Moving Average (SMA): Comprehensive Overview

The Simple Moving Average (SMA) is one of the most foundational and widely used tools in technical analysis across all financial markets, including Forex. Its primary function is to smooth out price action over a specified period, making it easier

How to Use Fibonacci to Place Your Stop To Reduce Loosing Money

How to Use Fibonacci Levels to Set the Perfect Stop Loss

The greatest challenge in trading isn’t finding a profitable entry; it’s managing risk once you’re in the trade. A poorly placed Stop-Loss (SL) is the single fastest way to deplete a trading account, leading either to premature exits (getting stopped

How to Use Fibonacci Extensions to Know When to Take Profit

How to Use Fibonacci Extensions to Know When to Take Profit

Fibonacci extensions are a powerful tool for traders looking to identify potential profit-taking levels in financial markets. Derived from the Fibonacci sequence, these extensions help predict where prices may head after a breakout or trend continuation. This article explores how

How to Analyze Trends With Moving Average Ribbons

How to Analyze Trends With Moving Average Ribbons

For many traders, a single Moving Average (MA) line provides limited information. The Moving Average Ribbon solves this problem by using a cluster of MAs to create a visual wave that instantly reveals the strength, momentum, and potential reversal points
How to Use Moving Average Envelopes

How to Use Moving Average Envelopes

Trading professionals utilize Moving Average Envelopes (MAE), a potent technical analysis tool, to spot trends, possible reversals, and overbought or oversold situations in financial markets. These envelopes assist traders in identifying critical price levels for starting or quitting trades by

How to Use Moving Averages as Dynamic Support and Resistance Levels

How to Use Moving Averages as Dynamic Support and Resistance Levels

Traders utilize moving averages (MAs), one of the most flexible tools in technical analysis, to find trends, entry locations, and, more recently, dynamic support and resistance levels. Static support and resistance levels are set at particular price points, but moving

How to Enter Trades Using Moving Average Crossovers

How to Enter Trades Using Moving Average Crossovers

Moving average crossovers are a cornerstone of technical analysis, widely used by traders to identify potential entry and exit points in financial markets. This powerful yet simple strategy leverages the interaction of two moving averages to signal trends, helping traders

How to Find the Trend with Moving Averages

How to Find the Trend with Moving Averages

Finding trends using moving averages is a popular method in data analysis, particularly in finance, economics, and time-series analysis. Moving averages smooth out data fluctuations to reveal underlying trends. This guide will show you how to use a single Moving

Simple vs. Exponential Moving Averages What is the Difference

Simple vs. Exponential Moving Averages: What is the Difference?

The Moving Average is the foundation of technical analysis. Almost every indicator, from the MACD to Bollinger Bands, relies on the concept of averaging past price data to identify a trend. However, when you open your trading platform, you’ll immediately

Exponential Moving Average (EMA) Beginner's Guide

Exponential Moving Average (EMA): Beginner’s Guide

The Exponential Moving Average (EMA) is one of the most popular and powerful tools in a technical trader’s arsenal. Like the Simple Moving Average (SMA), the EMA is designed to smooth out price action and help identify the true direction

Simple Moving Average (SMA) Comprehensive Overview

Simple Moving Average (SMA): Comprehensive Overview

The Simple Moving Average (SMA) is one of the most foundational and widely used tools in technical analysis across all financial markets, including Forex. Its primary function is to smooth out price action over a specified period, making it easier

How to Use Fibonacci to Place Your Stop To Reduce Loosing Money

How to Use Fibonacci Levels to Set the Perfect Stop Loss

The greatest challenge in trading isn’t finding a profitable entry; it’s managing risk once you’re in the trade. A poorly placed Stop-Loss (SL) is the single fastest way to deplete a trading account, leading either to premature exits (getting stopped

How to Use Fibonacci Extensions to Know When to Take Profit

How to Use Fibonacci Extensions to Know When to Take Profit

Fibonacci extensions are a powerful tool for traders looking to identify potential profit-taking levels in financial markets. Derived from the Fibonacci sequence, these extensions help predict where prices may head after a breakout or trend continuation. This article explores how

×
This website uses cookies and asks your personal data to enhance your browsing experience. We are committed to protecting your privacy and ensuring your data is handled in compliance with the General Data Protection Regulation (GDPR).

Join waitlist

Stay equipped and build your knowledge around the financial market. Get notified when we have fully launched.

coming soon app