


Resistance is a price level where an asset struggles to move higher due to increased selling pressure.
When the price approaches this level, sellers typically enter the market, preventing further upward movement.
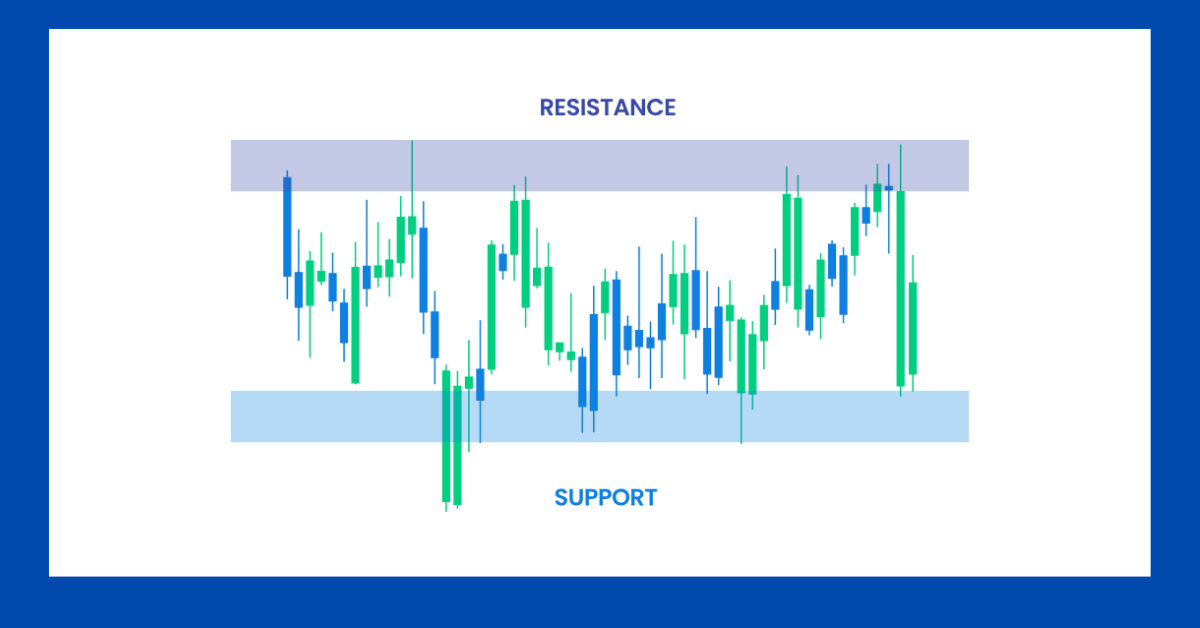
Once an area of support or resistant zone has been identified, those price levels can serve as potential entry or exit points because, as the price reaches a point of previous support or resistance, it will do one of two things: bounce back away from the support or resistance level, or violate the price level and continue in its prior direction—until it hits the next support or resistance level.
The timing of some trades is based on the belief that support and resistant zones will not be broken.
Whether the price is halted by or breaks through the support or resistance level, traders can bet on the direction of the price and quickly determine if they are correct
In This Post
Example of Resistance:
Suppose EUR/USD rises to 1.1200 multiple times but fails to break above it. This level acts as resistance because sellers dominate when the price reaches it, pushing it back down.
How to Identify Resistant Levels
Traders use various methods to spot resistant zones, and some includes:
Historical Price Action
Look for levels where the price repeatedly fails to rise above.
Trendlines and Chart Patterns
Draw a trendline connecting previous highs to highlight resistant areas.
Moving Averages
A moving average (e.g., 200-day MA) can act as dynamic resistance.
Fibonacci Retracement Levels
Resistant zone often aligns with key Fibonacci levels like 61.8%.
Strategies for Trading Around Resistance
Understanding resistant zone allows traders to plan their trades effectively. Here are three key strategies:
1. Sell at resistant zone
How it works
Short positions are placed when the price nears resistant zone, expecting a reversal.
Example: If USD/JPY hits resistance at 150.00 multiple times, traders may sell near this level.
Risk Management: Set stop-loss orders slightly above resistance to limit losses.
2. Trade Breakouts
- How it works: If price breaks above resistance, it signals a potential trend continuation.
- Confirmation: Look for increased volume and strong candle closes above resistance.
- Example: If GBP/USD breaks above 1.2700 resistance, it may continue rising, creating a buying opportunity.
3. Use Indicators for Confirmation
- RSI (Relative Strength Index): If RSI exceeds 70 near the resistant zone, a reversal may occur.
- Bollinger Bands: When price touches the upper band at the resistant zone, a pullback could follow.
- MACD (Moving Average Convergence Divergence): A bullish crossover above resistant may indicate a strong breakout.
Advantages and Risks of Resistant Zone Trading
Pros:
Clear Entry and Exit Points:
resistant zone offer well-defined trading opportunities.
Works in Various Market Conditions
Useful in both range-bound and trending markets.
Supports Risk Management:
Stop-loss orders can be placed efficiently above resistant zone
Cons:
False Breakouts:
Prices can temporarily break the resistant zone before reversing.
Market Volatility:
News events can disrupt resistant zone-based trading strategies.
Related Term

