


In the world of Forex Technical Analysis, Trend Lines are arguably the simplest, yet most powerful tools a trader can use. They provide an immediate visual representation of the market’s direction, speed, and potential reversal points. Mastery of drawing and interpreting these lines is fundamental to trading profitably. Simply put, a Trend Line is a straight line drawn directly onto a price chart that connects a series of successive peaks (highs) or successive troughs (lows), showing the prevailing direction of the market.
In This Post
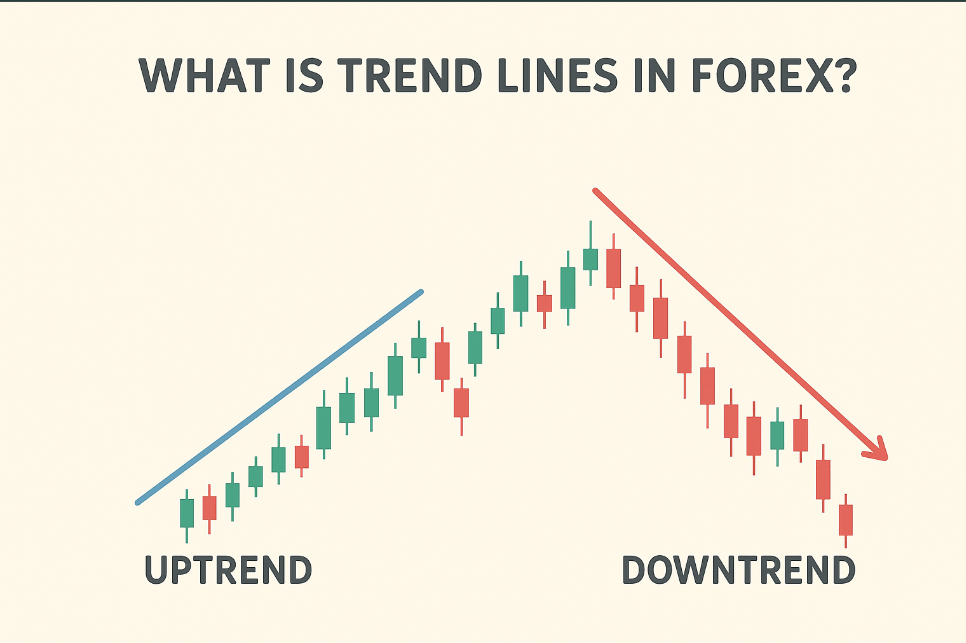
The Two Primary Types of Trend Lines
Trend lines act as dynamic forms of Support and Resistance that follow the price’s angle rather than remaining horizontal. They are categorized based on the market’s direction:
1. The Uptrend Line (Dynamic Support)
- Definition: An Uptrend Line (or Ascending Trend Line) is drawn below the price action by connecting at least two or more progressively higher low points (troughs).
- Function: It acts as a Dynamic Support level. When the price pulls back to this line, it is expected that buying interest will step in to defend the trend, causing the price to bounce and continue higher.
- Interpretation: This line confirms that buyers are continually entering the market at higher price levels, maintaining the bullish momentum.
2. The Downtrend Line (Dynamic Resistance)
- Definition: A Downtrend Line (or Descending Trend Line) is drawn above the price action by connecting at least two or more progressively lower high points (peaks).
- Function: It acts as a Dynamic Resistance level. When the price rallies to this line, it is expected that selling interest will step in to maintain the trend, causing the price to reverse and continue lower.
- Interpretation: This line confirms that sellers are continually entering the market at lower price levels, maintaining the bearish pressure.
The Three Rules for Drawing Valid Trend Lines
To be a truly reliable tool, a trend line must meet specific criteria. Avoid drawing lines that look nice but lack real market validation.
- Require Two Points, Confirm with Three: You need a minimum of two clear peaks or troughs to draw the line. However, the line is only considered validated and trustworthy once the price has touched or reacted to the line a third time. The more times the price bounces off the line, the stronger the trend line becomes.
- Angle Matters: The trend line should not be too flat (which suggests a weak, slow trend) or too steep (which indicates an unsustainable, aggressive trend prone to reversal). A sustainable trend typically falls within a -degree angle.
- Do Not Force the Line: The line must fit the price action; do not adjust or move the line to make it fit every single candle. The best trend lines are obvious and require minimal manipulation. For maximum accuracy, draw the line connecting the wicks (the extreme high/low prices).
Trading Opportunities Using Trend Lines
Trend lines are powerful because they provide clear, rules-based signals for entry, exit, and risk management.
Trading the Bounce (Continuation)
The most common strategy is trading the bounce. When the price approaches a validated trend line (Dynamic Support or Resistance), traders look for a confirmation candlestick pattern (like a Doji or Hammer) to signal the line is holding.
- Entry: Place a trade in the direction of the trend (buy at the uptrend line, sell at the downtrend line).
- Stop-Loss: Place the stop-loss order slightly outside the trend line. If the price breaks the line, the trend is likely broken, and you exit the trade.
Trading the Break (Reversal)
When a price candle closes decisively on the other side of a strong trend line, it signals that the current trend has exhausted and a reversal is probable.
- Confirmation: Wait for the candle to close completely outside the trend line to avoid “false breaks” or “head fakes.”
- Entry: Some aggressive traders enter immediately upon the close. Others wait for the price to retest the broken trend line from the opposite side before entering the new trend (this is the same Polarity principle that applies to horizontal S&R).
Frequently Asked Questions
Which timeframe should I use to draw trend lines?
- Higher timeframes (Daily, 4-Hour, and 1-Hour charts) produce the most reliable trend lines. Lines drawn on lower timeframes (like the 5-minute chart) are highly susceptible to market noise and result in unreliable signals. Always establish the major trend on a higher chart first.
What makes a trend line invalid?
- A trend line becomes invalid when a single price candle closes decisively outside of the line on the opposite side of the trend. This closing action confirms that the supply/demand balance has shifted and the original trend structure has broken.
Should I draw my trend line across the wicks or the bodies of the candles?
- For the most conservative and reliable signal, you should draw the trend line across the wicks (the extreme high or low prices). This ensures that the market has truly violated the full price range of the period before you consider the trend broken.
What is a “Channel” and how does it relate to a trend line?
- A Channel is formed when you draw a second line parallel to the main trend line. This parallel line acts as a secondary Resistance in an uptrend or Support in a downtrend. Trading within a channel allows traders to find clear target areas for profit-taking when the price reaches the opposite boundary.
Why do prices sometimes overshoot a trend line before bouncing back?
- Prices often overshoot or “spike” a trend line briefly because large institutions are actively hunting for clustered stop-loss orders placed just outside the line. This action, known as a stop hunt, generates the necessary liquidity before the market resumes its intended direction, proving that the trend line is still valid despite the brief violation.

