


Finding trends using moving averages is a popular method in data analysis, particularly in finance, economics, and time-series analysis. Moving averages smooth out data fluctuations to reveal underlying trends. This guide will show you how to use a single Moving Average and multiple Moving Average to accurately determine the direction, strength, and potential change points of forex trend.
In This Post
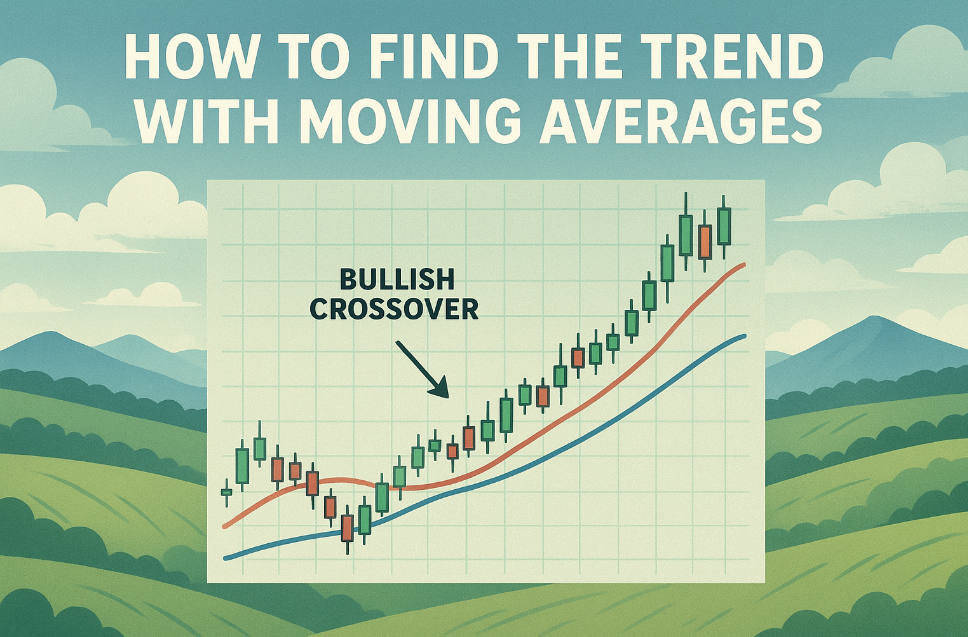
step-by-step guide on how to use moving averages to identify trends
Step 1: Identifying Trend Direction with a Single Moving Average
The simplest and most direct way to identify the trend is by observing the slope (or direction) of a single, well-chosen Moving Average.
The Logic of the Moving Average(MA) Slope
The direction of the MA line tells you the consensus of the price action over its look-back period (e.g., $50$ days).
- Upward Slope (Bullish Trend): If the MA is consistently angled up, it signifies that the average closing price is increasing. This confirms an Uptrend. You should be looking for opportunities to buy (long).
- Downward Slope (Bearish Trend): If the MA is consistently angled down, the average closing price is decreasing. This confirms a Downtrend. You should be looking for opportunities to sell (short).
- Flat Slope (Sideways/Ranging): A flat or horizontally trending MA indicates that the market is currently consolidating. This is a sign of a Range-Bound Market, where the trend is unclear and MAs are less reliable.
Price Position as Trend Confirmation
The position of the current price relative to the MA provides secondary confirmation and defines potential trading bias:
- Uptrend Confirmation: Price remains above the Moving Average.
- Downtrend Confirmation: Price remains below the Moving Average.
During a strong trend, the MA often acts as dynamic support (in an uptrend) or dynamic resistance (in a downtrend), offering excellent low-risk pullback entry points.
Step 2: Using Multiple Moving Averages for Crossover Signals
While a single MA defines the trend, using two or three MAs with different time periods is the most common technique for identifying trend changes and generating entry signals. This is called a Moving Average Crossover strategy.
The Crossover System Components
A successful crossover strategy requires defining two categories of MAs:
- The Fast MA (Short-Term): Uses a small period (e.g., $10$ or $20$). This MA is highly responsive and follows price closely.
- The Slow MA (Long-Term): Uses a larger period (e.g., $50$ or $200$). This MA is smoother and represents the core, underlying trend.
Generating Trend Change Signals
A definitive trend change signal occurs when the Fast MA crosses the Slow MA:
- The Golden Cross (The Bullish Signal): A Golden Cross occurs when the Fast MA crosses above the Slow MA. This signals that the short-term momentum has overcome the long-term trend, confirming a new, likely bullish uptrend.
- The Death Cross (The Bearish Signal): A Death Cross occurs when the Fast MA crosses below the Slow MA. This signals that short-term selling pressure is now driving the asset, confirming a new, likely bearish downtrend.
Step 3: Choosing the Right Moving Average for Your Timeframe
The MA period you select dictates the speed of your signals and the time horizon of the trend you are measuring. The ideal setting depends entirely on your trading style.
1. Fast MAs for Short-Term Trading (9- to 20-period)
These MAs are the most responsive and are essential for traders focused on intraday movements.
- Trading Style: Scalping and Day Trading.
- Trend Identified: Short-term momentum shifts and intraday direction.
- Common Periods: $9$, $10$, and $20$. Pro Tip: Use the Exponential Moving Average (EMA) for these faster signals.
2. Medium MAs for Swing Trading (50- to 100-period)
Medium-term MAs smooth out the daily volatility and show trends that last weeks or a few months.
- Trading Style: Swing Trading.
- Trend Identified: Medium-term direction and entries based on pullbacks.
- Common Periods: $50$ and $100$.
3. Slow MAs for Long-Term Investing (200-period)
The $200$-period MA is the institutional benchmark, providing a view of the macro trend and major market bias.
- Trading Style: Position Trading and Investing.
- Trend Identified: Macro trend and institutional bias.
- Common Period: $200$. Pro Tip: The Simple Moving Average (SMA) is often preferred for defining this structural, long-term support/resistance.
Step 4: Confirming the Trend Across Timeframes
Relying on a single indicator or a single timeframe is one of the biggest mistakes traders make. To confirm the reliability of a trend identified by MAs, you must look higher.
- Identify Macro Trend: First, check the trend on a high timeframe (e.g., the Daily chart) using a slow MA (e.g., $200$ MA). This gives you the overall macro bias.
- Filter Trades: Only take trades in the direction of the macro bias. If the Daily $200$ MA is sloping up, only look for Golden Crosses and uptrend pullbacks on your lower entry timeframe (e.g., the $1$-Hour chart).
- Use Volume/Momentum: Confirm the MA signal with a secondary momentum indicator like the RSI or MACD, or with volume. High volume on a breakout above a moving average adds strong conviction to the new trend.
Frequently Asked Questions (FAQs)
What is the most reliable moving average period for finding the trend?
- There is no single “most reliable” period. The $200$-period Moving Average (SMA or EMA) is widely considered the most important institutional measure of the long-term trend on Daily or Weekly charts. For most retail swing traders, the $50$-period MA is highly effective for identifying medium-term trends.
Should I use the SMA or the EMA for trend identification?
- The EMA is generally preferred for identifying a change in the trend because it is faster and more responsive to recent price action. The SMA is often preferred for confirming long-standing support and resistance levels because its smooth nature offers a more reliable barrier.
If the price crosses the MA, does that instantly mean the trend has changed?
- Not necessarily. The price crossing a single MA is only a potential warning of a trend change. You must wait for the MA’s slope itself to change direction and/or for a crossover between a fast and slow MA to occur before confirming a true, sustained trend reversal.
Are Moving Averages lagging indicators?
- Yes, all Moving Averages are inherently lagging indicators. They calculate their values based on past price data, meaning they confirm a trend that has already begun. They are not predictive. They are best used for confirmation, identifying pullbacks within an established trend, and determining exit points.
What is the difference between a Golden Cross and a Death Cross?
- A Golden Cross is a bullish signal where the faster Moving Average crosses above the slower Moving Average, indicating a likely new uptrend. A Death Cross is a bearish signal where the faster Moving Average crosses below the slower Moving Average, indicating a likely new downtrend.

