


Moving average crossovers are a cornerstone of technical analysis, widely used by traders to identify potential entry and exit points in financial markets. This powerful yet simple strategy leverages the interaction of two moving averages to signal trends, helping traders make informed decisions. In this article, we’ll explore how to use moving average crossovers to enter trades, key considerations, and tips to enhance your trading strategy. Plus, we’ve included a FAQ section to address common questions.
In This Post
What Are Moving Average Crossovers?
A moving average (MA) is a technical indicator that smooths out price data by calculating the average price over a specific period. A moving average crossover occurs when two moving averages of different periods intersect, signaling potential trend changes. The two most common types of moving averages used are:
- Simple Moving Average (SMA): The average price over a set number of periods (e.g., 50-day SMA).
- Exponential Moving Average (EMA): A weighted average that gives more importance to recent prices, making it more responsive to new data.
In a crossover strategy, traders typically use a short-term MA (e.g., 50-day) and a long-term MA (e.g., 200-day). The crossover points indicate potential buy or sell signals.
Types of Moving Average Crossovers
There are two primary crossover signals traders watch for:
- Golden Cross (Bullish Signal):
- Occurs when a short-term MA crosses above a long-term MA.
- Indicates a potential uptrend, signaling a buy opportunity.
- Example: A 50-day SMA crosses above a 200-day SMA.
- Death Cross (Bearish Signal):
- Occurs when a short-term MA crosses below a long-term MA.
- Suggests a potential downtrend, signaling a sell or short opportunity.
- Example: A 50-day SMA crosses below a 200-day SMA.
How to Enter Trades Using Moving Average Crossovers
Here’s a step-by-step guide to entering trades using moving average crossovers:
1. Choose Your Moving Averages
Select two moving averages with different periods based on your trading style:
- Day Traders: Use shorter periods (e.g., 5-day and 20-day EMAs) for quick signals.
- Swing Traders: Opt for medium periods (e.g., 20-day and 50-day SMAs).
- Long-Term Investors: Prefer longer periods (e.g., 50-day and 200-day SMAs).
EMAs are often favored for their sensitivity to recent price changes, while SMAs provide smoother, more stable signals.
2. Set Up Your Chart
Use a trading platform like TradingView, MetaTrader, or Thinkorswim to plot your chosen moving averages. Ensure your data (e.g., stock prices, forex pairs, or crypto) is sequential and evenly spaced (e.g., daily or hourly).
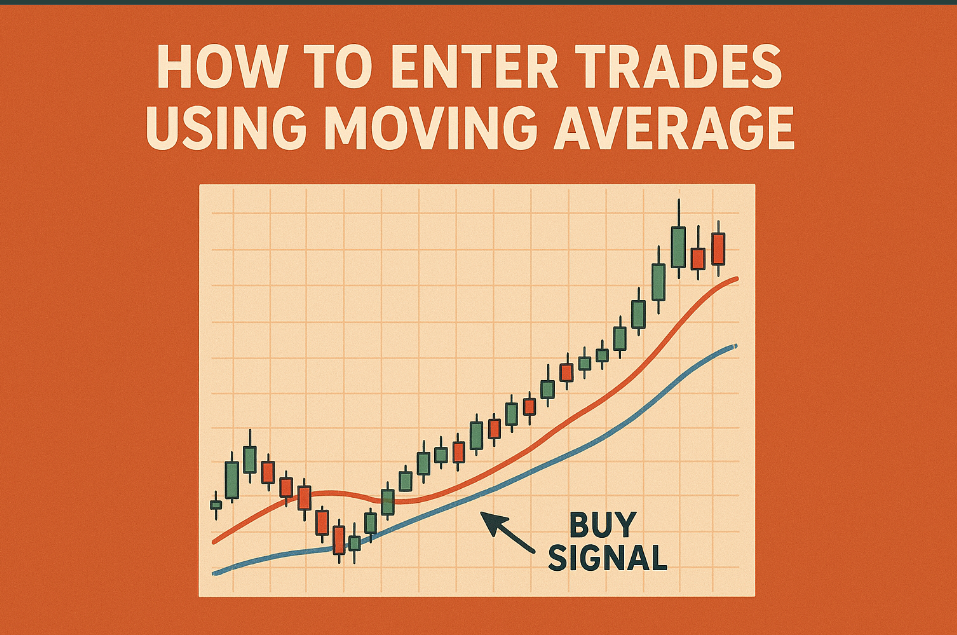
3. Identify the Crossover
Monitor your chart for crossover events:
- Buy Signal (Golden Cross): Enter a long position when the short-term MA crosses above the long-term MA. For example, if the 50-day EMA crosses above the 200-day EMA, it suggests bullish momentum.
- Sell/Short Signal (Death Cross): Enter a short position or exit a long position when the short-term MA crosses below the long-term MA.
4. Confirm the Signal
Moving average crossovers can produce false signals, especially in choppy markets. Use additional indicators to confirm the trend:
- Relative Strength Index (RSI): Ensure RSI is not overbought (above 70) for buy signals or oversold (below 30) for sell signals.
- Volume: Higher trading volume during a crossover strengthens the signal.
- Support/Resistance Levels: Check if the crossover aligns with key price levels.
5. Set Stop-Loss and Take-Profit Levels
Protect your capital and lock in profits:
- Stop-Loss: Place a stop-loss below recent support (for buys) or above resistance (for sells) to limit losses.
- Take-Profit: Set a target based on risk-reward ratios (e.g., 2:1) or technical levels like Fibonacci retracements.
6. Monitor and Exit the Trade
- Exit on Reversal: Consider exiting when the MAs cross in the opposite direction (e.g., a Death Cross after a Golden Cross).
- Trailing Stops: Use trailing stops to capture profits as the trend continues.
Example of a Moving Average Crossover Trade
Let’s say you’re trading a stock with the following setup:
- Chart: Daily chart with a 50-day SMA and 200-day SMA.
- Observation: On October 24, 2025, the 50-day SMA crossed above the 200-day SMA at $100, with rising volume and an RSI of 55 (not overbought).
- Action: Enter a long position at $100.
- Stop-Loss: Set at $95 (below recent support).
- Take-Profit: Target $110 (based on a 2:1 risk-reward ratio).
- Outcome: The stock rises to $112, and you exit with a profit when the 50-day SMA crosses below the 200-day SMA.
Tips for Success with Moving Average Crossovers
- Combine with Other Indicators: Pair crossovers with MACD, Bollinger Bands, or ADX to filter out false signals.
- Adjust Periods for Market Conditions: Test different MA periods to suit volatile or trending markets.
- Avoid Choppy Markets: Crossovers work best in trending markets; avoid using them in sideways or range-bound conditions.
- Backtest Your Strategy: Use historical data to test your crossover strategy’s performance before trading with real money.
- Stay Disciplined: Stick to your trading plan, including entry, exit, and risk management rules.
Benefits of Moving Average Crossovers
- Simplicity: Easy to understand and implement, even for beginners.
- Versatility: Applicable to stocks, forex, crypto, commodities, and more.
- Trend-Following: Helps traders ride strong trends for maximum profit potential.
Limitations of Moving Average Crossovers
- Lagging Indicator: MAs are based on past data, so signals may lag behind real-time price action.
- False Signals: Whipsaws (false crossovers) can occur in volatile or range-bound markets.
- Not Predictive: Crossovers confirm trends but don’t predict future price movements.
Moving average crossovers are a powerful tool for traders looking to capitalize on market trends. By understanding how to identify Golden and Death Crosses, confirming signals, and managing risk, you can improve your trading outcomes. Combine this strategy with other technical indicators, backtest thoroughly, and stay disciplined to maximize success. Whether you’re trading stocks, forex, or cryptocurrencies, moving average crossovers can help you navigate the markets with confidence.
Ready to start trading? Set up your charts, test your strategy, and begin identifying crossover opportunities today.
Frequently Asked Questions About Moving Average Crossovers
What is the best moving average crossover strategy?
- The best strategy depends on your trading style. For short-term trading, a 10-day and 50-day EMA crossover works well. For long-term investing, a 50-day and 200-day SMA crossover (Golden/Death Cross) is popular. Always backtest your strategy.
Can moving average crossovers be used for day trading?
- Yes, but use shorter periods (e.g., 5-day and 20-day EMAs) and higher time frames (e.g., 5-minute or 15-minute charts). Combine with volume and RSI to confirm signals.
How do I avoid false signals with moving average crossovers?
- Filter signals with additional indicators like RSI, MACD, or volume. Avoid trading in choppy or sideways markets, and confirm crossovers with support/resistance levels.
Should I use SMA or EMA for crossovers?
- EMAs are more responsive to recent price changes, making them better for short-term trading. SMAs are smoother and better for long-term trends. Test both to see what suits your market.
Can moving average crossovers be automated?
- Yes, you can automate crossover strategies using trading platforms like MetaTrader or programming languages like Python. Use APIs to execute trades when crossovers occur.

