


Traders utilize moving averages (MAs), one of the most flexible tools in technical analysis, to find trends, entry locations, and, more recently, dynamic support and resistance levels. Static support and resistance levels are set at particular price points, but moving averages adjust to price changes, which is what makes them “dynamic.” This article provides helpful techniques, examples, and advice to improve your trading approach while explaining how to use moving averages as dynamic support and resistance levels.
In This Post
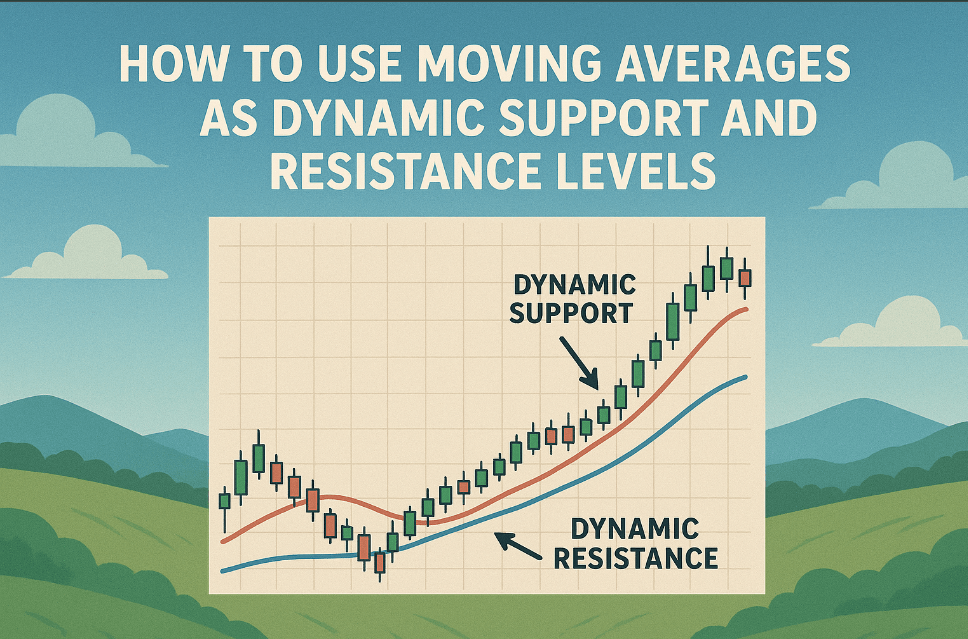
What Are Dynamic Support and Resistance Levels?
Support is a price level where a downtrend tends to pause due to buying interest, preventing further declines. Resistance is a price level where an uptrend often stalls due to selling pressure. Traditional support and resistance levels are static, drawn as horizontal lines on a chart. However, dynamic support and resistance levels, derived from moving averages, move with the price, adapting to market trends over time.
A moving average smooths price data over a specific period, creating a line that can act as:
- Dynamic Support: Prices tend to bounce off the moving average during uptrends.
- Dynamic Resistance: Prices struggle to break above the moving average during downtrends.
Types of Moving Averages for Dynamic Support and Resistance
The two most common moving averages used for this purpose are:
- Simple Moving Average (SMA): Calculates the average price over a set period (e.g., 50-day SMA). It’s smoother and ideal for identifying long-term support/resistance.
- Exponential Moving Average (EMA): Gives more weight to recent prices, making it more responsive to short-term price changes.
Popular periods include:
- Short-term (10-day or 20-day): For day or swing trading.
- Medium-term (50-day): For intermediate trends.
- Long-term (200-day): For major trend analysis.
How to Use Moving Averages as Dynamic Support and Resistance
Here’s a step-by-step guide to effectively use moving averages as dynamic support and resistance levels:
1. Select the Right Moving Average
Choose a moving average based on your trading style:
- Day Traders: Use a 10-day or 20-day EMA for quick, responsive signals.
- Swing Traders: Opt for a 50-day SMA or EMA for intermediate trends.
- Long-Term Investors: Use a 200-day SMA for major support/resistance levels.
Test different periods to find what works best for your market (e.g., stocks, forex, crypto).
2. Plot the Moving Average on Your Chart
Use a trading platform like TradingView, MetaTrader, or Thinkorswim to add your chosen moving average to a price chart. Ensure your data is sequential (e.g., daily or hourly prices).
3. Identify Dynamic Support in an Uptrend
In an uptrend, the moving average often acts as dynamic support:
- Prices tend to pull back to the MA and bounce upward.
- Example: If a stock is trending above its 50-day SMA, the SMA acts as a floor where buyers step in, supporting the price.
- Action: Consider buying when the price touches or approaches the moving average and shows signs of bouncing (e.g., bullish candlestick patterns like a hammer).
4. Identify Dynamic Resistance in a Downtrend
In a downtrend, the moving average acts as dynamic resistance:
- Prices often rise to the MA but struggle to break through, falling back.
- Example: If a forex pair is trading below its 200-day SMA, the SMA acts as a ceiling where sellers dominate.
- Action: Consider selling or shorting when the price nears the moving average and shows rejection (e.g., bearish candlestick patterns like a shooting star).
5. Confirm with Other Indicators
To avoid false signals, confirm price interactions with the moving average using:
- Candlestick Patterns: Look for reversal patterns (e.g., doji, engulfing) at the MA.
- Volume: Higher volume on a bounce or rejection strengthens the signal.
- Other Indicators: Use RSI, MACD, or Bollinger Bands to confirm trend strength or reversals.
6. Set Stop-Loss and Take-Profit Levels
- Stop-Loss: Place below the moving average for buys (support) or above it for sells (resistance) to limit losses.
- Take-Profit: Target key price levels (e.g., previous highs/lows) or use a risk-reward ratio (e.g., 2:1).
7. Monitor Price Action
- Watch how the price interacts with the moving average over time.
- If the price consistently respects the MA as support or resistance, it’s a reliable level.
- If the price breaks through the MA with strong volume, it may signal a trend reversal.
Example of Using Moving Averages as Dynamic Support/Resistance
Suppose you’re trading a stock with a 50-day SMA on a daily chart:
- Scenario: The stock is in an uptrend, trading above its 50-day SMA at $100. The price pulls back to $101 and bounces off the 50-day SMA with high volume and a bullish engulfing pattern.
- Action: Enter a long position at $101.
- Stop-Loss: Set at $98 (below the 50-day SMA).
- Take-Profit: Target $110 (based on a previous high).
- Outcome: The stock rises to $112, and you exit with a profit when the price breaks below the 50-day SMA.
Tips for Success
- Combine with Static Levels: Use traditional support/resistance levels alongside MAs for stronger confirmation.
- Adjust Periods: Test different MA periods to match market volatility and your trading horizon.
- Avoid Choppy Markets: Moving averages work best in trending markets; avoid using them in sideways markets to reduce false signals.
- Backtest Your Strategy: Use historical data to verify how often the MA acts as reliable support or resistance.
- Stay Disciplined: Follow your trading plan, including entry, exit, and risk management rules.
For traders looking to follow market trends, using moving averages as dynamic support and resistance levels is a potent tactic. You can improve your trading decisions by choosing the appropriate MA, validating signals with price movement and indicators, and engaging in prudent risk management. Gaining proficiency in this method will help you recognize important price levels and enhance your trading results, regardless of your degree of experience.
Frequently Asked Questions (FAQs)
What happens when the price breaks the MA?
- If the price decisively breaks and closes on the opposite side of a key MA (like the $50$ or $200$), it is a strong indication that the current trend is ending or has already reversed. This event can signal an exit from the current trade or preparation for a trade in the opposite direction.
Should I use the $50$ SMA or $50$ EMA for dynamic Support and Resistance?
- The Exponential Moving Average (EMA) is generally more responsive and better for dynamic S&R, especially on lower timeframes, because it weights recent price action more heavily. The Simple Moving Average (SMA) is often reserved for the $200$ period to define the very long-term, structural support.
How do I know if a moving average will hold as support or resistance?
- Look for price reactions at the MA, such as bounces or rejections, confirmed by candlestick patterns, volume, or other indicators like RSI or MACD.
Should I use SMA or EMA for dynamic support and resistance?
- EMAs are more responsive and better for short-term trading, while SMAs are smoother and suited for long-term trends. Experiment with both to find what works best.
How can I avoid false signals when using moving averages?
- Combine MAs with other indicators (e.g., volume, RSI) and avoid trading in choppy or sideways markets. Confirm signals with price action or static support/resistance levels.

