


The Keltner Channels indicator is a powerful tool for traders looking to analyze market trends, gauge volatility, and identify potential entry or exit points. Whether you’re trading forex, stocks, or cryptocurrencies, this volatility-based indicator can enhance your technical analysis. This article explains how to use Keltner Channels effectively, covering setup, interpretation, strategies, and common pitfalls, followed by five frequently asked questions to deepen your understanding.
In This Post
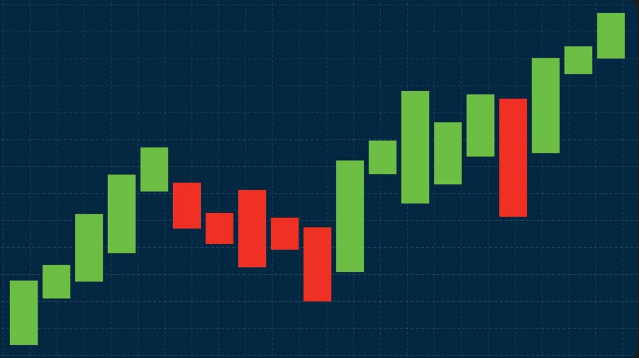
What is the Keltner Channels Indicator?
Keltner Channels, developed by Chester Keltner in the 1960s, consist of three lines: a central exponential moving average (EMA) and two outer bands calculated using the Average True Range (ATR). Unlike Bollinger Bands, which use standard deviation, Keltner Channels rely on ATR for band width, making them smoother and better suited for trending markets. The middle line is typically a 20-period EMA of the typical price (high + low + close divided by 3), with the upper band set at the EMA plus 2x ATR and the lower band at the EMA minus 2x ATR. This setup helps traders identify trend direction, overbought or oversold conditions, and potential breakouts.
Setting Up Keltner Channels
To use Keltner Channels, you’ll need a charting platform like TradingView, MetaTrader 4/5, or Thinkorswim, where the indicator is readily available. Follow these steps to set it up:
- Access the indicator by searching for “Keltner Channels” in your platform’s indicator library.
- Use default settings: a 20-period EMA for the middle line, a 10-period ATR, and a 2x multiplier for the bands. For short-term trading, try a 10-period EMA and 1.5x multiplier; for longer-term, consider a 50-period EMA.
- Customize the appearance by assigning distinct colors to the middle line and bands for clarity.
- Apply the indicator to your chosen asset, such as EUR/USD for forex, Apple stock, or Bitcoin.
Once applied, the channels will surround the price action, expanding or contracting based on market volatility.
Interpreting Keltner Channels
Understanding the signals provided by Keltner Channels is key to effective trading. Here’s how to interpret them:
Trend Direction
In an uptrend, the price tends to stay near or above the upper band, with the middle EMA acting as dynamic support. In a downtrend, the price hugs the lower band, with the middle line serving as resistance. A price consistently trading near the middle line suggests a range-bound market with no clear trend.
Volatility and Overbought/Oversold Conditions
When the price touches or crosses the upper band, it may indicate an overbought condition, suggesting a potential pullback. Conversely, a price at or below the lower band signals an oversold condition, hinting at a possible reversal. Expanding channels indicate rising volatility, often during strong trends, while contracting channels suggest consolidation or low volatility.
Breakouts and Pullbacks
A breakout occurs when the price closes decisively above the upper band (bullish) or below the lower band (bearish), often signaling the start of a strong trend. Pullbacks to the middle EMA during a trend can offer low-risk entry points, as the price may bounce off this level as support or resistance.
Trading Strategies with Keltner Channels
Here are practical strategies to incorporate Keltner Channels into your trading:
- Trend-Following Strategy: Enter a long position when the price breaks above the upper band in an uptrend, confirmed by a rising middle EMA. For a downtrend, enter a short position on a break below the lower band. Exit when the price returns to the middle line or the trend weakens (e.g., channels contract).
- Pullback Trading: In an uptrend, wait for the price to pull back to the middle EMA and show signs of support (e.g., a bullish candlestick pattern) before entering a long position. In a downtrend, look for resistance at the middle EMA for short entries.
- Breakout Trading: Trade breakouts when the price closes outside the bands with high volume or a strong candle. Combine with other indicators like the Relative Strength Index (RSI) to confirm momentum.
- Range Trading: In a flat market, buy near the lower band and sell near the upper band, but be cautious as Keltner Channels are less effective in choppy conditions.
For volatile markets like cryptocurrencies, use shorter periods (e.g., 10-period EMA) to capture rapid price movements. Always backtest your strategy on historical data to optimize settings.
Advantages and Limitations
Advantages
- Clear trend signals: The channels visually highlight trend direction and strength.
- Volatility insight: ATR-based bands adapt to changing market conditions.
- Versatility: Effective across asset classes, including forex, stocks, and crypto.
Limitations
- Lagging indicator: As a moving average-based tool, it may lag in fast-moving markets.
- False signals in ranges: Sideways markets can produce whipsaws, leading to losses.
- Requires confirmation: Best used with other indicators like RSI or MACD to filter signals.
Tips for Success
To maximize the effectiveness of Keltner Channels:
- Combine with volume analysis or momentum indicators to confirm signals.
- Use stop-loss orders below the lower band (for longs) or above the upper band (for shorts) to manage risk.
- Avoid over-optimizing settings; stick to defaults unless backtesting shows clear improvements.
- Practice on a demo account to familiarize yourself with the indicator’s signals.
The Keltner Channels indicator is a versatile tool that helps traders identify trends, gauge volatility, and time entries and exits with precision. By setting up the indicator correctly, interpreting its signals, and applying proven strategies, you can enhance your trading performance across various markets. Combine it with sound risk management and complementary indicators for the best results.
Frequently Asked Questions
What is the difference between Keltner Channels and Bollinger Bands?
- Keltner Channels use the Average True Range (ATR) to set band width, making them smoother and more trend-focused. Bollinger Bands use standard deviation, which makes them more sensitive to price volatility but prone to noise in choppy markets.
What are the best settings for Keltner Channels?
- The default settings (20-period EMA, 10-period ATR, 2x multiplier) work well for most markets. For short-term trading, try a 10-period EMA and 1.5x multiplier; for longer-term, use a 50-period EMA. Always backtest to suit your trading style.
Can Keltner Channels be used for day trading?
- Yes, Keltner Channels are effective for day trading, especially with shorter periods (e.g., 10-period EMA) on lower timeframes like 5-minute or 15-minute charts. Focus on pullbacks or breakouts for quick trades.
How do I avoid false signals with Keltner Channels?
- Combine Keltner Channels with indicators like RSI, MACD, or volume to confirm signals. Avoid trading in range-bound markets, where false breakouts are common, and use stop-loss orders to manage risk.
Are Keltner Channels suitable for all markets?
- Yes, they work across forex, stocks, commodities, and cryptocurrencies. However, adjust the settings based on the asset’s volatility,shorter periods for crypto, longer for stable stocks and always test your strategy.

