


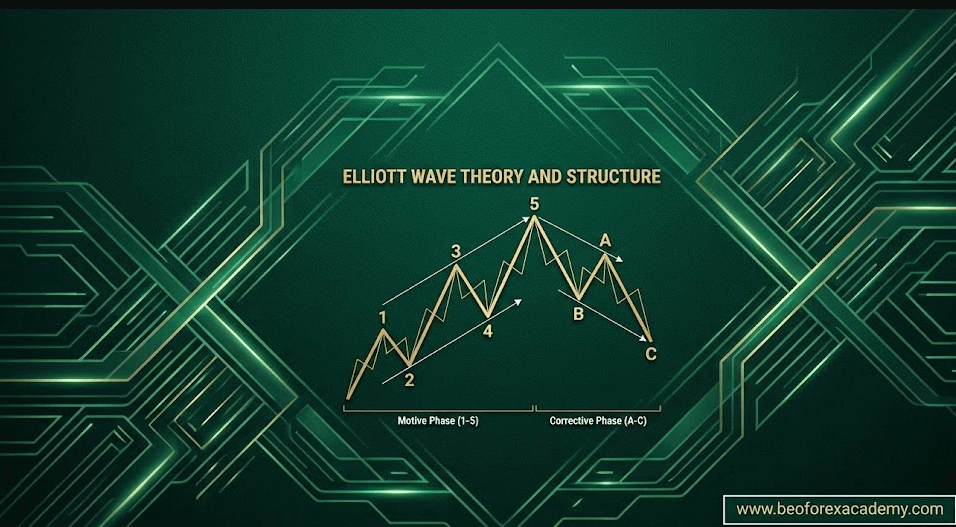
Elliott Wave Theory is a highly effective and commonly used technical analysis tool for projecting market direction, targets, and reversals. Ralph Nelson Elliott developed the hypothesis in the 1930s, which says that markets move in repeating wave patterns influenced by collective investor psychology. Understanding the Elliott Wave structure enables traders to predict trend continuations, pullbacks, and critical turning points in forex, equities, and cryptocurrency.
This article explains the full Elliott Wave Theory structure, degrees, labeling, rules, and practical application, everything you need to start counting waves correctly.
In This Post
Core Principle of Elliott Wave Theory
Markets do not move randomly. They advance in 5-wave impulse patterns (with the trend) followed by 3-wave corrective patterns (against the trend). This 5-3 cycle repeats across all timeframes in a fractal manner — waves are made of smaller waves, which are part of larger waves.
The complete cycle is 8 waves:
5-wave impulse (1-2-3-4-5) + 3-wave correction (A-B-C)
After the A-B-C correction, a new larger-degree impulse begins, creating the famous “waves within waves” fractal structure.
Elliott Wave Degrees: The Fractal Structure
Elliott identified 9 wave degrees from minutes to centuries:
- Grand Supercycle: decades–centuries
- Supercycle: years–decades
- Cycle: 1–several years
- Primary: months–years
- Intermediate: weeks–months
- Minor: weeks
- Minute: days
- Minuette: hours
- Subminuette: minutes
You label waves with numbers (1-2-3-4-5) for impulse and letters (A-B-C) for correction. Larger-degree waves use brackets or Roman numerals.
Impulse Wave Structure (Motive Phase – 5 Waves)
The 5-wave impulse moves with the larger trend:
- Wave 1: Initial move often weak, doubted by most
- Wave 2: Sharp retracement (50–78.6%) scares out early buyers
- Wave 3: Strongest and usually longest — high volume, news supports trend
- Wave 4: Complex sideways correction (38.2–50%) never overlaps Wave 1
- Wave 5: Final push,often on lower volume shows divergence
One of Waves 1, 3, or 5 will extend (most commonly Wave 3).
Corrective Wave Structure (3 Waves – A-B-C)
After the impulse, a 3-wave correction moves against the trend:
- Wave A: First leg against trend (can look like new impulse)
- Wave B: Partial retracement of A (38–79%) traps traders
- Wave C: Final leg,usually 100–161.8% of A
Main corrective patterns:
- Zigzag (5-3-5) — sharp
- Flat (3-3-5) — sideways
- Triangle (3-3-3-3-3) — contracting
Complex corrections (Double/ Triple Three) use “X” connector waves.
The 3 Hard Rules of Impulse Waves
These must never be broken:
- Wave 2 never retraces more than 100% of Wave 1
- Wave 3 is never the shortest among 1, 3, 5
- Wave 4 never overlaps price territory of Wave 1 (except diagonals)
Violation = invalid count.
Key Guidelines (Occur Most of the Time)
- Alternation: If Wave 2 is sharp, Wave 4 is sideways (and vice versa)
- Wave 3 Extension: Wave 3 is usually longest
- Channeling: Impulse waves fit parallel trend channels
- Fibonacci Dominance:
- Wave 2 = 50–61.8%
- Wave 3 = 161.8–423.6% of Wave 1
- Wave 4 = 38.2–50% of Wave 3
- Wave 5 ≈ Wave 1 or 61.8% of Waves 1–3
How to Apply Elliott Wave Structure in Trading
- Identify the larger-degree trend (Daily/Weekly)
- Count the 5-wave impulse on lower timeframe
- Wait for Wave 3 breakout or Wave C end for entries
- Use Fibonacci + volume for confirmation
- Never force counts — if rules break, relabel
Best trades:
Real-World Example: Bitcoin 2024–2025 Bull Cycle
- Wave 1: $15k → $70k (2023–2024)
- Wave 2: Sharp drop to $50k (61.8%)
- Wave 3: Ongoing to $150k+ (extension expected)
- Wave 4: Future sideways correction
- Wave 5: Final push to $200k–$300k
Traders who recognized Wave 3 early made 300%+ returns.
Common Mistakes in Elliott Wave Structure
- Counting every move as Wave 3
- Ignoring the no-overlap rule
- Forcing counts on low timeframes
- Not using multiple degrees
Elliott Wave Theory and structure reveal the hidden rhythm of markets. The 5-3 fractal pattern repeats endlessly once you see it, you’ll never look at charts the same way. Start simple: label the last major swing on Daily EUR/USD or BTC/USD using the 3 hard rules and Fibonacci ratios. With practice, Elliott Waves become your edge for spotting the biggest moves before they happen.
Frequently Asked Questions
How many waves are in a complete Elliott Wave cycle?
- 8 waves: 5-wave impulse (1-2-3-4-5) + 3-wave correction (A-B-C).
Which Elliott Wave is the strongest?
- Wave 3 is usually the longest, highest volume, and most profitable to trade.
Can Elliott Waves predict exact prices?
- No exact prices, but Fibonacci ratios give high-probability targets (161.8%, 261.8%, etc.).
Do Elliott Waves work in crypto and forex?
- Yes,especially on higher timeframes (H4, Daily, Weekly). Works best with volume confirmation.
What if my wave count breaks a rule?
- The count is invalid relabel. Markets always follow the rules; your count was wrong.





