


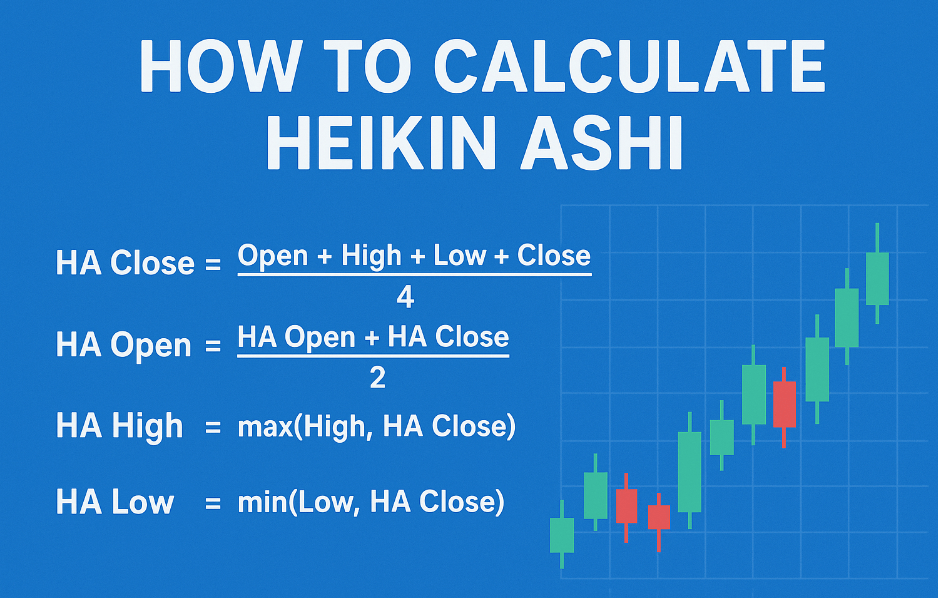
Knowing how to calculate Heikin Ashi manually gives you full control over the indicator, helps you understand why it filters noise so well, and lets you code custom versions. This article explains the exact Heikin Ashi formula, step-by-step calculation, real examples, and trading applications for forex, stocks, and crypto.
In This Post
What is Heikin Ashi and Why Calculate It Manually?
Heikin Ashi modifies standard Japanese candlesticks by averaging price data, creating smoother charts that highlight trends and reduce false signals.
Calculating it yourself is useful when:
- You want to build custom indicators in TradingView Pine Script or Python
- Your platform doesn’t have Heikin Ashi built-in
- You need backtest strategies with precise values
The Official Heikin Ashi Formula
Heikin Ashi candles are calculated using these four values:
- HA-Close (Heikin Ashi Close) HA-Close = (Open + High + Low + Close) / 4
- HA-Open (Heikin Ashi Open) HA-Open = (Previous HA-Open + Previous HA-Close) / 2 (For the very first candle, use (Open + Close) / 2)
- HA-High (Heikin Ashi High) HA-High = Maximum of (Current High, HA-Open, HA-Close)
- HA-Low (Heikin Ashi Low) HA-Low = Minimum of (Current Low, HA-Open, HA-Close)
That’s it — only these four lines.
Step-by-Step Heikin Ashi Calculation Example
Let’s calculate the first three Heikin Ashi candles for EUR/USD H1.
Standard Candles Data:
Candle 1
Open: 1.0900 | High: 1.0925 | Low: 1.0880 | Close: 1.0915
Candle 2
Open: 1.0915 | High: 1.0940 | Low: 1.0905 | Close: 1.0930
Candle 3
Open: 1.0930 | High: 1.0955 | Low: 1.0920 | Close: 1.0945
Candle 1 (First HA Candle)
HA-Close₁ = (1.0900 + 1.0925 + 1.0880 + 1.0915) / 4 = 1.0905
HA-Open₁ = (1.0900 + 1.0915) / 2 = 1.0908
HA-High₁ = Max(1.0925, 1.0908, 1.0905) = 1.0925
HA-Low₁ = Min(1.0880, 1.0908, 1.0905) = 1.0880
Candle 2
HA-Close₂ = (1.0915 + 1.0940 + 1.0905 + 1.0930) / 4 = 1.0923
HA-Open₂ = (1.0908 + 1.0905) / 2 = 1.0907
HA-High₂ = Max(1.0940, 1.0907, 1.0923) = 1.0940
HA-Low₂ = Min(1.0905, 1.0907, 1.0923) = 1.0905
Candle 3
HA-Close₃ = (1.0930 + 1.0955 + 1.0920 + 1.0945) / 4 = 1.0938
HA-Open₃ = (1.0907 + 1.0923) / 2 = 1.0915
HA-High₃ = Max(1.0955, 1.0915, 1.0938) = 1.0955
HA-Low₃ = Min(1.0920, 1.0915, 1.0938) = 1.0915
You now have smooth, trending Heikin Ashi candles.
Best Ways to Use Calculated Heikin Ashi
- Trend Filter: Trade only in direction of HA color
- Pullback Entries: Buy green candles on dip to 20 EMA
- Exit Signal: First opposite-color candle or doji
- Combine With: 50 EMA, RSI, Volume
Common Mistakes When Calculating Heikin Ashi
- Forgetting recursive HA-Open (using raw open instead)
- Starting every candle from scratch
- Using wrong data order (always previous HA values)
- Applying on tick/renko charts (use only time-based)
Now You Know How to Calculate Heikin Ashi. Mastering the Heikin Ashi calculation gives you a deeper edge, you can now build custom indicators, backtest accurately, and never rely blindly on black-box tools.
Frequently Asked Questions
Do Heikin Ashi candles repaint?
- No, they are calculated from closed candle data only. Safe for live trading.
Why does my manual Heikin Ashi look slightly different from TradingView?
- Minor rounding differences or platform using adjusted close. The difference is usually <1 pip.
Can I calculate Heikin Ashi for the USD/NGN parallel market?
- Yes, just input daily open/high/low/close from parallel market rates.
Is the first Heikin Ashi candle always inaccurate?
- Yes, it has no previous HA data. Most traders ignore the first 1–2 candles or use standard open/close.
How many candles are needed for reliable Heikin Ashi?
- At least 5–10 for the averaging effect to stabilize. After that, the smoothing is excellent.





