


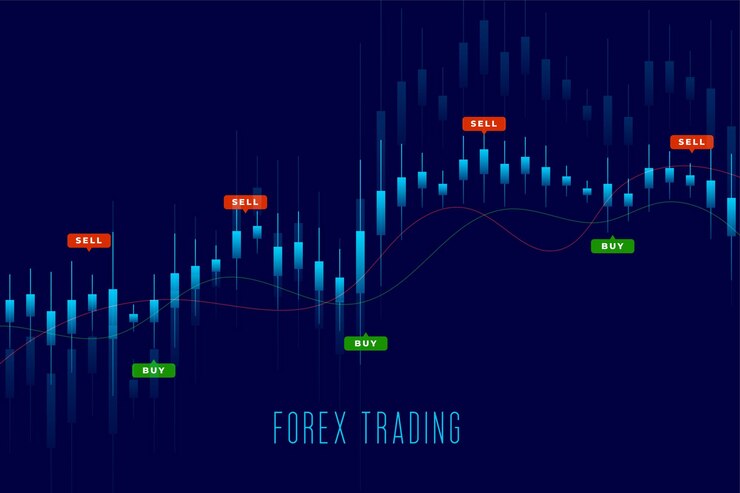
Many Forex traders across the world uses different effective indicators and one of those is Relative Volatility Index (RVI).
It is a technical indicator made to measure the volatility of price movements in the market and it helps traders assess market conditions and identify potential trading opportunities.
It is particularly helpful in the forex market when volatility is what is needed in determining market direction and risk.
But what exactly is the Relative Volatility Index (RVI)?
The Relative Volatility Index (RVI) is a momentum oscillator similar to the Relative Strength Index (RSI), but instead of tracking price momentum, the RVI measures volatility.
It was developed by Donald Dorsey in the 1990s. The RVI uses standard deviation to determine how much volatility is present in the market, which WILL HELP YOU identify trends and potential reversals.
The RVI ranges between 0 and 100, with values above 50 indicates increasing volatility. Values below 50 SHOWS decreasing volatility. This makes it very helpful for identifying periods of high or low market activity.
In This Post
How Does the Relative Volatility Index Work?
The Relative Volatility Index is calculated by comparing the current volatility of price movements to the historical volatility over a given period. The formula for RVI involves the following steps:
Calculate the Standard Deviation (Volatility): The RVI calculates volatility by measuring the standard deviation of the price over a set period.
Determine the Positive and Negative Deviations: The RVI considers positive and negative price changes to understand the market’s directional movement.
Calculate the RVI Value: The RVI is then calculated using a formula similar to the RSI but with standard deviation applied instead of price changes. The result is an oscillator that can indicate market volatility levels.
How to Intepret Relative Volatility Index
The RVI provides valuable information about market volatility and potential trading opportunities. Here’s how to interpret the readings:
1. RVI Above 50 means that Market Volatility is Increasing
When the RVI is above 50, it indicates that volatility is rising, and the market is more likely to experience strong price movements. This can signal a trend, either bullish or bearish, and traders can use it to identify breakout opportunities.
Trend Continuation: If the market is already in an established trend, an RVI reading above 50 suggests that the trend is likely to continue with increased volatility. Traders may use this information to look for potential entry points in the direction of the trend.
2. RVI Below 50 means that Market Volatility is Decreasing.
When the RVI is below 50, it suggests that market volatility is low, and price movements are more likely to be stagnant. This can signal consolidation periods where the market is moving sideways.
Potential for Reversal: Low volatility, combined with other indicators, may also signal the potential for a reversal. Traders might use this to identify areas where the market could break out of consolidation, either up or down.
3. RVI Crossovers
Crossing Above 50: When the RVI crosses above the 50 level, it can be interpreted as a signal that volatility is picking up and that a potential trend or breakout may follow.
Crossing Below 50: When the RVI crosses below 50, it suggests reduced volatility, which may indicate a period of consolidation or a potential reversal after a prolonged trend.
How to Use RVI for Forex Trading
The RVI can be used in several ways to improve your forex trading strategy:
1. Trend Confirmation
The RVI can be used to confirm the strength of a trend. When the RVI is above 50, it indicates that volatility is increasing and may confirm the continuation of a bullish or bearish trend.
Traders use this to enter positions in the direction of the trend, with more confidence that the trend will continue.
2. Breakout Strategy
Breakouts often occur when volatility increases, which the RVI helps to identify.
If the RVI crosses above the 50 level during a consolidation period, it may signal the start of a breakout. Traders can use this information to enter the market as the price moves outside a previously established range.
3. Volatility-Based Entries
Traders can use RVI values to identify when volatility is sufficiently high to take on riskier trades. When the RVI rises, indicating increasing volatility, it can be an opportunity to trade breakouts or trends.
On the other hand, when volatility is low (RVI below 50), it may be a sign to avoid trading or wait for better conditions.
4. Divergence
Just like the RSI, the RVI can also be used for spotting divergence. If the price makes new highs or lows, but the RVI fails to reach similar levels, this could indicate that the current trend is weakening and that a reversal may be imminent.
Why Combining the RVI with Other Indicators is Useful
To increase the effectiveness of the RVI, it’s a good idea to use it in conjunction with other indicators. Some effective combinations include:
1. RVI + Moving Averages
Combining the RVI with moving averages (e.g., the 50-day or 200-day moving average) can help traders confirm trends and entry points. If the RVI shows increasing volatility above 50 and the price is above a moving average, this may indicate a strong uptrend.
2. RVI + RSI
The Relative Volatility Index and Relative Strength Index (RSI) are complementary indicators. While the RVI measures volatility, the RSI tracks price momentum. Using both indicators together can provide a fuller picture of market conditions and increase the accuracy of trade setups.
3. RVI + MACD
The Moving Average Convergence Divergence (MACD) is another useful indicator that can be combined with the RVI to identify strong trends and potential reversals.
Pros and Cons of Using the RVI
Pros
- Helps Identify Breakouts: The RVI is particularly effective in identifying when volatility increases, helping traders spot potential breakouts.
- Versatile: It can be used across various timeframes and can be adapted to different forex strategies.
- Simple to Interpret: The RVI’s scale of 0 to 100 makes it easy for traders to understand the level of volatility in the market.
Cons
- Not a Standalone Indicator: While useful, the RVI should not be used in isolation. It’s best used in combination with other indicators for more accurate signals.
- Lagging Indicator: Like other technical indicators, the RVI is based on historical data and may lag behind current market conditions.
Frequently Asked Questions
1. What is the Relative Volatility Index (RVI)?
The Relative Volatility Index (RVI) is a technical indicator that measures market volatility by comparing current volatility to historical volatility. It helps traders identify periods of high or low volatility in the market, indicating potential trends or reversals.
2. How do you use the RVI for forex trading?
The RVI can be used to confirm trends, spot potential breakouts, and assess market conditions. When the RVI is above 50, it suggests increasing volatility, which may signal the continuation of a trend. When it is below 50, it indicates decreasing volatility, which may point to consolidation or a potential reversal.
3. Can the RVI be used for short-term trading?
Yes, the RVI can be used for short-term trading strategies, especially in conjunction with other indicators like moving averages or the RSI. It’s effective for spotting volatility spikes, which often lead to short-term trends or breakouts.
4. Is the RVI better than the RSI?
The RVI and RSI are both momentum indicators, but they focus on different aspects. The RSI measures price momentum, while the RVI measures volatility.
While they can be used together for a more comprehensive view, neither is necessarily better than the other; they serve different purposes in trading.
Conclusion
The Relative Volatility Index (RVI) is a valuable tool for forex traders looking to gauge market volatility and make informed trading decisions.
So when you know how to interpret RVI readings and use it in combination with other technical indicators, it will improve your ability to identify trends, breakouts, and potential reversals.
While it should not be relied upon as the one and only indicator for trade decisions, the RVI can improve your trading strategy because you will understand market conditions.

