What are Chart Patterns and How are they Traded?
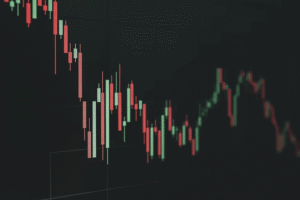
Chart patterns are specific formations that appear regularly on price charts, reflecting the repetitive psychological behavior of market participants (buyers and sellers). They are the graphic foundation of technical analysis, offering traders a probabilistic roadmap for future price action. Patterns