


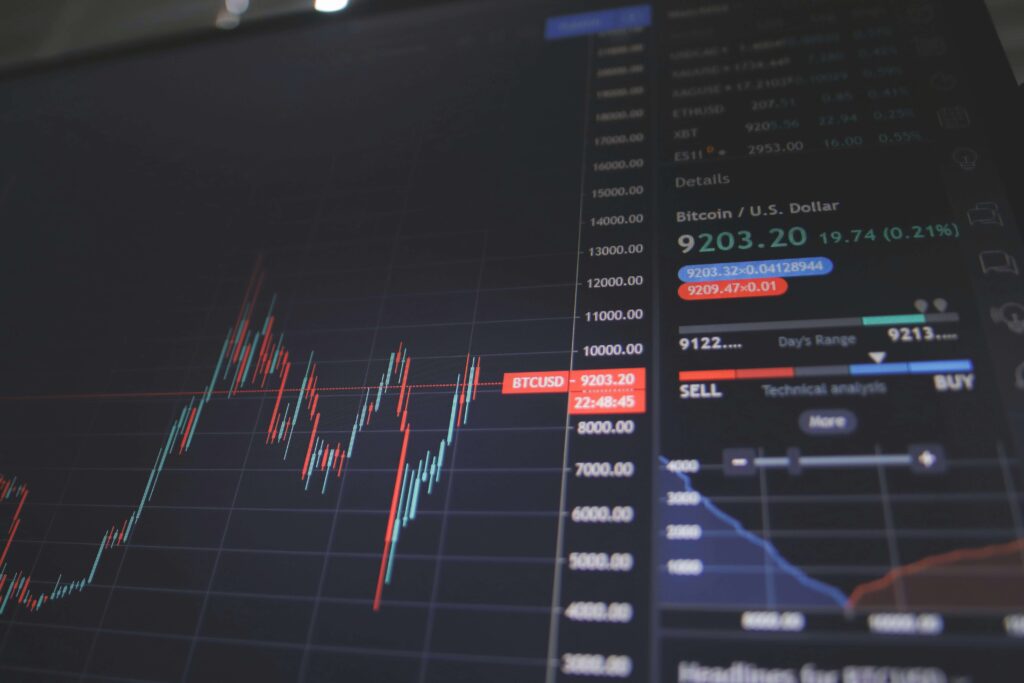
With hundreds of indicators available, traders often ask: What is the best technical indicator in forex? The truth is, there is no single “best” indicator that works perfectly in all market conditions. In the fast-paced world of forex trading, technical indicators are essential tools for analyzing price movements, identifying trends, and making informed trading decisions.
The effectiveness of any indicator depends on your trading style, timeframe, market environment, and how you combine it with other tools. This comprehensive guide explores the most popular and reliable forex indicators, their strengths, and how to choose the one that suits your strategy best.
In This Post
Understanding Technical Indicators in Forex
Technical indicators are mathematical calculations based on price, volume, or open interest data. They help traders forecast future price movements by identifying patterns, momentum, trends, and potential reversals. Forex indicators fall into four main categories:
- Trend Indicators: Identify the direction of the market (e.g., Moving Averages, ADX).
- Momentum Indicators: Measure the speed of price changes (e.g., RSI, Stochastic).
- Volatility Indicators: Gauge market fluctuations (e.g., Bollinger Bands, ATR).
- Volume Indicators: Analyze trading activity (e.g., OBV, though less common in forex due to decentralized volume).
The “best” indicator aligns with your goals. whether you’re scalping, day trading, or swing trading and work in synergy with price action and risk management.
Top Contenders for the Best Forex Technical Indicator
Here are the most widely used and respected indicators in forex trading, each with unique strengths:
1. Moving Averages (MA)
Moving averages smooth price data to reveal the underlying trend. The Simple Moving Average (SMA) and Exponential Moving Average (EMA) are favorites among forex traders.
- Why it’s powerful: Crossovers (e.g., 50-period EMA crossing above 200-period EMA) signal trend changes. Pullbacks to the MA often act as support/resistance.
- Best for: Trend-following strategies on higher timeframes (H4, Daily).
2. Relative Strength Index (RSI)
The RSI measures momentum on a scale of 0 to 100, identifying overbought (>70) and oversold (<30) conditions.
- Why it’s powerful: It excels at spotting divergences—when price makes a new high but RSI doesn’t, signaling potential reversals.
- Best for: Range-bound markets and divergence trading.
3. MACD (Moving Average Convergence Divergence)
MACD shows the relationship between two EMAs (typically 12 and 26 periods) and includes a signal line and histogram.
- Why it’s powerful: Crossovers, histogram expansion, and zero-line crosses provide clear entry/exit signals.
- Best for: Momentum and trend confirmation in trending markets.
4. Bollinger Bands
Consisting of a middle SMA and two standard deviation bands, Bollinger Bands measure volatility.
- Why it’s powerful: Band squeezes predict breakouts; price touching the outer band can signal overextension.
- Best for: Volatility breakout and mean-reversion strategies.
5. Fibonacci Retracement
Though not a traditional indicator, Fibonacci levels (38.2%, 50%, 61.8%) are widely used to find support and resistance.
- Why it’s powerful: Traders use it to identify pullback entry points in strong trends.
- Best for: Swing trading and combining with other indicators.
So, What is the Best Technical Indicator in Forex?
There is no universal best indicator, but Moving Averages (especially EMA crossovers) are often cited as the most versatile and beginner-friendly. They work across all currency pairs and timeframes, require minimal interpretation, and form the basis of many professional strategies. For advanced traders, combining RSI with MACD or Bollinger Bands with price action often yields superior results.
A 2023 survey by the Financial Markets Association found that 68% of retail forex traders use moving averages as their primary indicator, followed by RSI (42%) and MACD (35%). Professional traders, however, rarely rely on a single tool—over 80% use 2–4 indicators in combination.
How to Choose the Right Indicator for Your Trading
- Match Your Style: Scalpers prefer fast indicators like Stochastic; swing traders lean toward MAs and Fibonacci.
- Consider Market Conditions: Use trend indicators (MA, ADX) in trending markets; oscillators (RSI, CCI) in ranging markets.
- Backtest Thoroughly: Test any indicator on historical data using platforms like MetaTrader or TradingView.
- Combine Indicators: Avoid conflicting signals by pairing a trend indicator with a momentum tool (e.g., EMA + RSI).
- Prioritize Simplicity: Overloading charts with indicators leads to analysis paralysis.
Common Mistakes to Avoid
- Indicator Overload: Using too many tools creates confusion and false signals.
- Ignoring Price Action: Indicators should confirm, not replace, candlestick patterns and support/resistance.
- Curve Fitting: Adjusting settings to perfectly fit past data often fails in live markets.
- Trading Solely on Indicators: Always use proper risk management (stop-loss, position sizing).
While there’s no single “best technical indicator in forex,” moving averages stand out for their reliability, simplicity, and universal application. For optimal results, combine 1–2 indicators with clean price action analysis and a solid trading plan. The real edge comes not from the indicator itself, but from how consistently and disciplined you apply it. Start with moving averages, master one strategy, and gradually incorporate complementary tools. Platforms like BabyPips and Forex Factory offer free resources to deepen your technical analysis skills.
Frequently Asked Questions
Is there a single best technical indicator for forex trading?
- No. The best indicator depends on your strategy, timeframe, and market conditions. Moving averages are the most popular due to their versatility, but combining tools like RSI and MACD often works better.
Which indicator is best for scalping in forex?
- For scalping, fast-reacting indicators like the 5-period EMA, Stochastic Oscillator, or Bollinger Bands on 1-minute or 5-minute charts are ideal. Focus on high-liquidity pairs like EUR/USD.
Can I rely on one indicator for all currency pairs?
- It’s not recommended. While moving averages work across pairs, volatile pairs like GBP/JPY may require wider stops or volatility filters (e.g., ATR), while ranging pairs like EUR/CHF suit oscillators.
What is better: RSI or Stochastic?
- Both measure momentum, but RSI is smoother and better for divergences, while Stochastic reacts faster and suits short-term overbought/oversold signals. Use RSI for swing trading, Stochastic for scalping.
Should beginners use complex indicators like Ichimoku?
- No. Beginners should start with simple moving averages and RSI. Master price action and basic indicators before exploring advanced tools like Ichimoku or ADX.





