


Successful Forex trading often comes down to one thing: timing. Knowing when a correction will end and the primary trend will resume is the difference between a profitable entry and a missed opportunity. The most effective way to pinpoint this reversal moment is by combining the mathematical probability of Fibonacci Retracements with the psychological confirmation of Japanese Candlesticks.
This powerful combination creates a high-probability Confluence Zone, a price level where technical expectation meets real-time market action.
In This Post
Defining the Roles: Location vs. Timing
Understanding how each tool functions independently is the key to mastering their combination:
1. Fibonacci Retracements: The Location Hunter
The Fibonacci tool, anchored to a clear Swing High and Swing Low, projects the most likely price levels where a pullback (retracement) should terminate. These levels are derived from the golden ratio, a fundamental constant in nature and finance. Key levels like 38.2%, 50.0% (a crucial psychological midpoint), and the 61.8% Golden Ratio act as powerful magnetic barriers where institutional flow tends to reverse.
- Fibonacci’s Role: To identify the location—the where—the market is most likely to reverse. It tells you where to place your pending buy or sell orders, or simply where to watch the chart intently. By using these mathematically significant areas, we reduce the subjectivity of anticipating reversals.
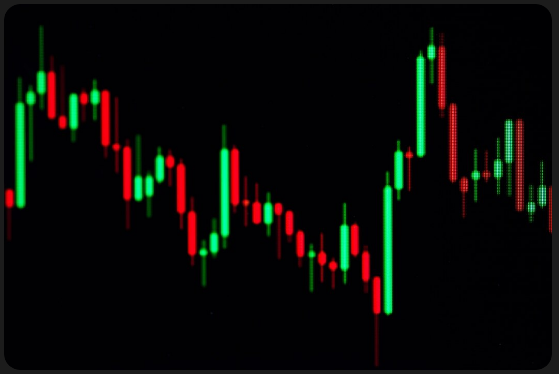
2. Japanese Candlesticks: The Timing and Trigger
Candlesticks tell the story of the current period, visually representing the fight between buyers (bulls) and sellers (bears). A candlestick’s body and wicks instantly convey who controlled the session and whether a level was fiercely defended. When a strong candlestick reversal pattern forms at a key Fibonacci level, it acts as the final, critical confirmation that the mathematical probability is playing out in real-time.
- Candlestick’s Role: To provide the timing and trigger—the when—to enter the trade. It confirms that the buyers (or sellers) have actually stepped in to defend the Fibonacci level, turning a simple price level into a verified barrier.
The Strategy: the Perfect Confirmation
The process of combining these two tools is disciplined and mechanical, designed to filter out noise and false signals.
Step 1: Anchor the Fibonacci Tool
First, establish the direction of the current impulse move (the strong leg of the trend) and draw your Fibonacci tool correctly on a higher timeframe (e.g., $4$-Hour or Daily). The selection of the correct Swing High and Swing Low—the definitive turning points of the move—is paramount for the accuracy of the entire setup.
- Uptrend (Buy Setup): Anchor from the Swing Low up to the Swing High of the recent move. This calculation reveals the potential support levels (retracements) where buyers will re-enter. Watch for reversal signals at the $38.2%, $50.0%, and $61.8% levels as price pulls back.
- Downtrend (Sell Setup): Anchor from the Swing High down to the Swing Low of the recent move. This calculation reveals the potential resistance levels where sellers will defend the trend. Watch for reversal signals at the $38.2%, $50.0%, and $61.8% levels as price pulls up.
Step 2: Identify the Reversal Candlestick
As the price hits one of the key Fibonacci levels, you must wait for a strong single or dual-candlestick pattern to form and close. The pattern must show clear rejection of the price level.
- At Confluence Support (Pullback in Uptrend, Buy Setup): Look for Bullish Candlestick Patterns such as the Hammer or the Bullish Engulfing pattern. These signals show that buyers have aggressively defended the Fibonacci support level.
- At Confluence Resistance (Pullback in Downtrend, Sell Setup): Look for Bearish Candlestick Patterns such as the Shooting Star or the Bearish Engulfing pattern. These signals show that sellers have aggressively defended the Fibonacci resistance level.
- The Hammer/Shooting Star: These single candles are powerful rejection signals. A Hammer at a Fib support level has a small body and a long lower wick, signaling sellers were initially active but buyers overpowered them. A Shooting Star at a Fib resistance level signals the opposite.
- The Engulfing Pattern: This dual-candle pattern is even stronger. A Bullish Engulfing at Fib support means the second candle’s body completely swallows the previous bearish candle’s body, confirming a massive influx of buyers.
Step 3: Execute and Manage the Trade
The moment the confirming candlestick closes, your entry is validated.
- Entry: Place a market order immediately after the reversal candle closes.
- Stop-Loss: Place the stop-loss order safely on the opposite side of the Candlestick pattern’s wick. This is the tightest and most accurate placement, ensuring that if the market breaks the confirmation candle’s high/low, your technical premise is broken. The ultimate safety level is beyond the $78.6\%$ Fibonacci level.
- Take-Profit: Target the previous Swing High/Low where you anchored the Fib tool, or use Fibonacci Extensions ($127.2% or $161.8%) to project future profit levels.
Avoiding the Common Pitfalls
1. The “Middle of Nowhere” Mistake
A strong reversal candlestick (like a Hammer) is meaningless if it forms in the middle of a trend, far from any major Fibonacci level. Context is everything. Only trade the pattern when it confirms the defense of a pre-determined Fibonacci level.
2. Trading Too Small a Timeframe
Candlestick signals on the $1$-minute or $5$-minute charts are unreliable noise. Limit your use of this confluence strategy to signals forming on the $1$-Hour, $4$-Hour, or Daily charts. The longer the time frame, the more institutional money has contributed to the candle’s shape, making the signal more reliable.
3. Ignoring the Close
Never enter a trade until the reversal candlestick has fully closed. If a candle is currently forming a beautiful Hammer at the $61.8\%$ level, but you enter early, it could reverse at the last minute and close as a bearish marble, trapping you in a losing position. Patience is non-negotiable.
Frequently Asked Questions
Which Candlestick patterns are best to use with Fibonacci?
- The most reliable patterns are those that show clear rejection and a momentum shift: the Hammer (at support), the Shooting Star (at resistance), and the Engulfing Patterns (Bullish or Bearish). These signals are powerful because they leave little doubt about which side won the battle at the key Fib level.
Can I use this strategy to trade breakouts?
- Yes, indirectly. If the price hits the $61.8%$ level and, instead of forming a reversal pattern, a large, momentum-driven candle slices straight through and closes convincingly beyond the 78.6% level, the Fibonacci has failed. The strong close signals a breakout of the trend, and you can then look to trade in the opposite direction.
What if a Doji forms at the Fibonacci level?
- A Doji (a small body with equal wicks) signals indecision. When a Doji forms at a Fibonacci level, it means buyers and sellers are testing the level but neither has taken control yet. The best action is to wait for the next candle to open and close, as it will often resolve the indecision and confirm the direction.
Should I use a Limit Order or wait for the candlestick close?
- Always wait for the candlestick to close and use a Market Order (entering immediately). Using a Limit Order means you are guessing the Fib level will hold. The closed candlestick is your confirmation that the level has held and the reversal has begun.
Does this work on all currency pairs?
- Yes. The Fibonacci sequence is a universal constant, and Japanese Candlesticks reflect market psychology common to all liquid markets. This confluence strategy is equally effective on major pairs (EUR/USD, GBP/USD), cross pairs, and even commodities like Gold.

