


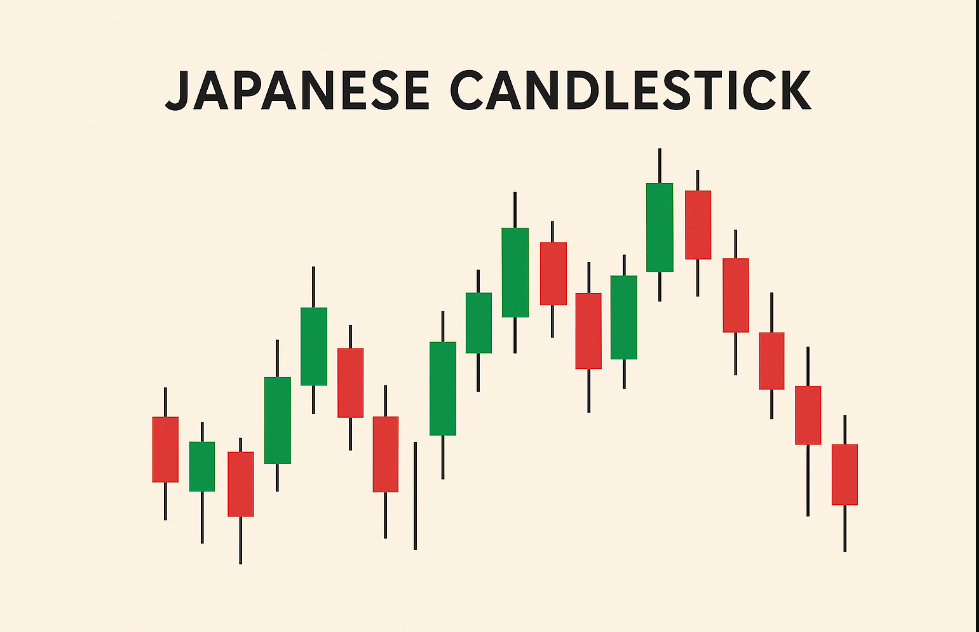
The Japanese Candlestick chart is the single most popular and powerful tool for analyzing price action in the Forex, stock, and crypto markets. More than just a visual display of price data, a candlestick is a miniature story that captures the battle between buyers and sellers over a specific time period. Understanding how to read these unique symbols is the foundation of modern technical analysis, providing insights into market momentum, potential reversals, and psychological shifts that traditional line or bar charts simply cannot match.
In This Post
The Origin and Analysis of the Japanese Candlestick
The concept of charting price using these shapes dates back to the century, where a Japanese rice merchant named Homma Munehisa first used it to forecast rice prices. Its powerful simplicity led to its adoption by Western financial markets centuries later.
Every single candlestick, regardless of the timeframe (from one minute to one month), represents four critical pieces of price data (OHLC):
- Open Price: The price at which trading began during the period.
- High Price: The highest price reached during the period.
- Low Price: The lowest price reached during the period.
- Close Price: The price at which trading ended during the period.
The Two Core Components
A single candlestick consists of two parts, each telling a specific story:
1. The Real Body (The Block)
This is the thick, rectangular part of the candle. It represents the range between the Open and the Close price. Its color and size instantly communicate who won the fight during that period:
- Bullish Candle (Often Green or White): The price Closed Higher than it Opened. This signifies that buyers (bulls) were in control and pushed the price up during the period, indicating positive momentum.
- Bearish Candle (Often Red or Black): The price Closed Lower than it Opened. This signifies that sellers (bears) were in control and drove the price down, indicating negative momentum.
2. The Wicks (Shadows)
These are the thin lines extending above and below the real body. They are also known as shadows and represent the extreme High and Low prices reached during the period.
- Upper Wick: Shows the highest price that was temporarily tested before being pushed back down.
- Lower Wick: Shows the lowest price that was temporarily tested before being pushed back up.
What Candlesticks Reveal About Market Psychology
The true power of the candlestick lies in how the size of the body relates to the length of the wicks. This relationship provides immediate psychological insight:
Momentum vs. Indecision
- Large Body, Small Wicks: A large body (either bullish or bearish) with very short wicks suggests strong, confident momentum. The price opened, moved aggressively in one direction, and closed near the high (or low) of the period. This confirms conviction.
- Small Body, Long Wicks (Doji or Spinning Top): A small body surrounded by long upper and lower wicks signifies indecision. Buyers and sellers fought hard, pushing the price high and low, but ultimately, neither side could maintain control, and the price closed near the open. This often signals a temporary pause or an imminent reversal in the trend.
Price Rejection
Wicks are the most important sign of price rejection. A long wick extending from the bottom of a candle, with a small body, tells the story of a Hammer pattern: sellers drove the price down to a new low, but were forcefully overwhelmed by buyers who pushed the price all the way back up to close near the high. This type of rejection is a powerful bullish reversal signal.
Why Traders Prefer Candlestick Charts
Candlesticks offer superior analysis compared to the older chart types:
- Visual Clarity: The immediate visual distinction between a green (up) and a red (down) body makes trend recognition instantaneous.
- Pattern Recognition: Candlesticks form reliable, named patterns (like the Engulfing, Morning Star, or Shooting Star) that provide high-probability signals for market reversal or continuation. Line charts cannot display these patterns.
- Depth of Information: They provide the full OHLC data in one easy-to-read unit, allowing traders to assess volatility (wick length) and momentum (body size) simultaneously.
Why Are Japanese Candlesticks Important?
Japanese candlesticks are widely used because they:
- Provide Clear Visuals: Candlesticks make it easy to spot trends, reversals, and patterns.
- Reveal Market Sentiment: The size and shape of candles indicate whether buyers or sellers are in control.
- Support Pattern Recognition: Candlesticks form patterns (e.g., Doji, Hammer, Engulfing) that signal potential market moves.
- Apply to All Timeframes: Whether you’re a day trader or a long-term investor, candlesticks are versatile across different timeframes.
5 Common Candlestick Patterns
Candlestick patterns are combinations of one or more candles that traders use to predict price movements. Some popular patterns include:
- Doji: A candle with a very small body, signaling indecision in the market.
- Hammer: A bullish reversal pattern with a small body and a long lower wick, often seen at the bottom of a downtrend.
- Engulfing Pattern: A two-candle pattern where a small candle is followed by a larger candle that “engulfs” it, indicating a potential reversal.
- Morning Star: A three-candle bullish reversal pattern signaling the end of a downtrend.
- Shooting Star: A bearish reversal pattern with a small body and a long upper wick, often seen at the top of an uptrend.
4 Effective Ways to Use Japanese Candlesticks in Trading
To effectively use candlesticks, traders should:
- Identify Trends: Look for a series of bullish or bearish candles to confirm the market direction.
- Spot Reversal Patterns: Use patterns like Doji or Engulfing to anticipate trend changes.
- Combine with Indicators: Pair candlesticks with tools like moving averages, RSI, or support/resistance levels for better accuracy.
- Practice Risk Management: Always use stop-loss orders and proper position sizing to protect your capital.
Benefits of Japanese Candlesticks
- Universal Application: Used in stocks, forex, crypto, and more.
- Historical Reliability: Proven effective for centuries.
- Enhanced Decision-Making: Helps traders make informed decisions based on price action.
Frequently Asked Questions
What is the difference between a bullish and bearish candlestick?
- A bullish candlestick forms when the closing price is higher than the opening price, indicating buying pressure (typically green or white). A bearish candlestick forms when the closing price is lower than the opening price, showing selling pressure (typically red or black).
How do candlestick patterns help in trading?
- Candlestick patterns help traders identify potential market trends, reversals, or continuations. Patterns like Doji or Hammer provide insights into market sentiment, allowing traders to make informed decisions.
Can Japanese candlesticks be used in all markets?
- Yes, Japanese candlesticks are versatile and can be used in any market with price data, including stocks, forex, cryptocurrencies, commodities, and indices.
What is a Doji candlestick, and why is it important?
- A Doji candlestick has a very small body, where the opening and closing prices are very close. It signals market indecision and often precedes a trend reversal or continuation, depending on the context.
How can beginners start using Japanese candlesticks?
- Beginners should start by learning basic candlestick patterns, practicing on demo trading accounts, and combining candlesticks with other technical indicators to confirm signals. Studying historical charts also helps build familiarity.





