


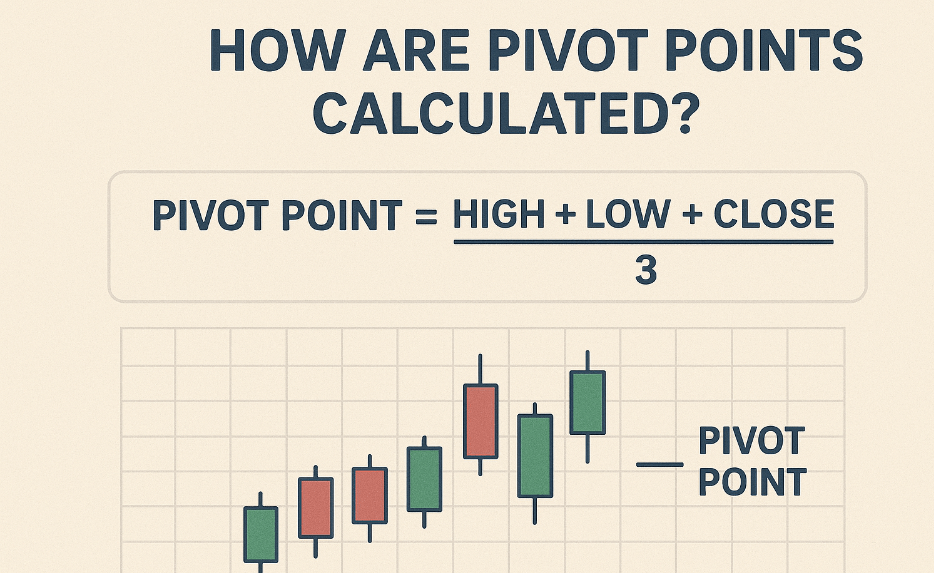
How are pivot points calculated? This question is in the minds of forex traders who are curious about pivot points. Pivot points are essential tools for traders seeking precise support and resistance levels. Knowing how pivot points are calculated empowers you to generate accurate intraday levels for forex, stocks and crypto trading in Nigeria and beyond. This article explains the standard formula, variations, step-by-step calculation, tools, and practical examples to help you master pivot point math.
In This Post
What Are Pivot Points?
Pivot points are technical indicators derived from the previous trading session’s high, low, and close prices. They create a central pivot (PP) with support (S1–S3) and resistance (R1–R3) levels to forecast potential price turning zones.
Traders in Akwa Ibom, Abuja, and across Nigeria use pivot points daily for:
- Day trading Naira pairs (USD/NGN)
- NASDAQ, FTSE, and crypto entries
- Risk management with tight stops
Levels reset at 00:00 GMT (1:00 AM WAT), aligning perfectly with global sessions.
Standard Pivot Point Formula: How It’s Calculated
The classic (standard) pivot point uses a simple arithmetic average.
Core Calculation Steps
- Gather Previous Session Data:
- High (H)
- Low (L)
- Close (C)
- Calculate Central Pivot Point (PP): PP = (High + Low + Close) / 3
- Calculate Resistance Levels:
- R1 = (2 × PP) – Low
- R2 = PP + (High – Low)
- R3 = High + 2 × (PP – Low)
- Calculate Support Levels:
- S1 = (2 × PP) – High
- S2 = PP – (High – Low)
- S3 = Low – 2 × (High – PP)
Most platforms auto-calculate, but understanding the math ensures accuracy.
Step-by-Step Example: Calculating Daily Pivot Points
Let’s calculate using EUR/USD previous day (November 9, 2025):
Previous Day Data:
- High: 1.0950
- Low: 1.0850
- Close: 1.0900
Step 1: PP
PP = (1.0950 + 1.0850 + 1.0900) / 3 = 3.2700 / 3 = 1.0900
Step 2: R1 & S1
R1 = (2 × 1.0900) – 1.0850 = 2.1800 – 1.0850 = 1.0950
S1 = (2 × 1.0900) – 1.0950 = 2.1800 – 1.0950 = 1.0850
Step 3: R2 & S2
Range = High – Low = 1.0950 – 1.0850 = 0.0100
R2 = 1.0900 + 0.0100 = 1.1000
S2 = 1.0900 – 0.0100 = 1.0800
Step 4: R3 & S3
R3 = 1.0950 + 2 × (1.0900 – 1.0850) = 1.0950 + 0.0100 = 1.1050
S3 = 1.0850 – 2 × (1.0900 – 1.0850) = 1.0850 – 0.0100 = 1.0750
Final Levels (November 10, 2025):
PP: 1.0900 | R1: 1.0950 | R2: 1.1000 | R3: 1.1050
S1: 1.0850 | S2: 1.0800 | S3: 1.0750
Different Types of Pivot Points and Their Calculations
1. Fibonacci Pivot Points
Applies Fibonacci ratios to the range:
- R1 = PP + 0.382 × (H – L)
- R2 = PP + 0.618 × (H – L)
- R3 = PP + 1.000 × (H – L)
- S1/S2/S3: Subtract same ratios
2. Camarilla Pivot Points
Focuses on intraday reversals (8 levels):
- R4 = Close + (High – Low) × 1.1 / 2
- R3 = Close + (High – Low) × 1.1 / 4
- S3/S4: Subtract same multipliers
3. Woodie Pivot Points
Weights close price more:
PP = (High + Low + 2 × Close) / 4
R1 = (2 × PP) – Low
S1 = (2 × PP) – High
4. DeMark Pivot Points
Uses conditional logic:
- If Close < Open → X = High + (2 × Low) + Close
- If Close > Open → X = (2 × High) + Low + Close
- PP = X / 4
Tools to Calculate Pivot Points Automatically
No need for manual math—use these free tools trusted by Nigerian traders:
- TradingView: Built-in pivot indicator (standard, fib, etc.)
- MetaTrader 4/5: Download “Pivot Points” script
- Investing.com Pivot Calculator: Web-based, mobile-friendly
- BabyPips Pivot Tool: Beginner-friendly
- Excel/Google Sheets: Copy formula for custom sessions
How to Use Calculated Pivot Levels in Trading
Once calculated:
- Bullish Bias: Price opens above PP → buy S1 bounces
- Bearish Bias: Price opens below PP → sell R1 rallies
- Range Play: Trade PP as midpoint
- Breakout: Close beyond R1/S1 → target R2/S2
Pro Tip: Combine with RSI, volume, or candlesticks for confirmation.
Common Mistakes in Pivot Point Calculation
- Using wrong session close (e.g., local time vs GMT)
- Mixing daily and weekly data
- Forgetting rollover adjustments in forex
- Ignoring high-impact news near levels
- Calculating mid-week without reset
Real-World Example: USD/NGN Pivot Calculation
November 9 Data (Parallel Market):
High: ₦1,650 | Low: ₦1,620 | Close: ₦1,635
PP = (1650 + 1620 + 1635) / 3 = ₦1,635
R1 = (2 × 1635) – 1620 = ₦1,650
S1 = (2 × 1635) – 1650 = ₦1,620
November 10 Trade: Price opens at ₦1,638 → bullish. Buy dip to S1 (₦1,620) → target PP.
Knowing how pivot points are calculated gives you full control over your intraday levels. Use the standard formula for simplicity, or explore Fibonacci/Camarilla for advanced strategies. Calculate daily at 1:00 AM WAT, plot on H1/H4 charts, and trade with volume confirmation. Nigerian traders can start with EUR/USD, GBP/USD, or USD/NGN on TradingView. Practice manual calculation 10 times—then let tools do the work.
Frequently Asked Questions
What time should I calculate daily pivot points in Nigeria?
- Calculate at 1:00 AM WAT (00:00 GMT) using the previous day’s New York close (5:00 PM EST).
Which pivot point type is best for forex?
- Standard pivot points for beginners. Camarilla for scalping EUR/USD or GBP/USD during London session.
Can I calculate pivot points manually in Excel?
Yes Use:
- = (High + Low + Close)/3 for PP
- = (2*PP) – Low for R1
Copy for all levels.
Do pivot points work on USD/NGN or crypto?
- Yes,especially daily pivots on high-volume pairs. Crypto uses UTC close (00:00).
Should I recalculate pivots intraday?
- No,daily pivots are fixed. Only recalculate for weekly/monthly or new session.





