


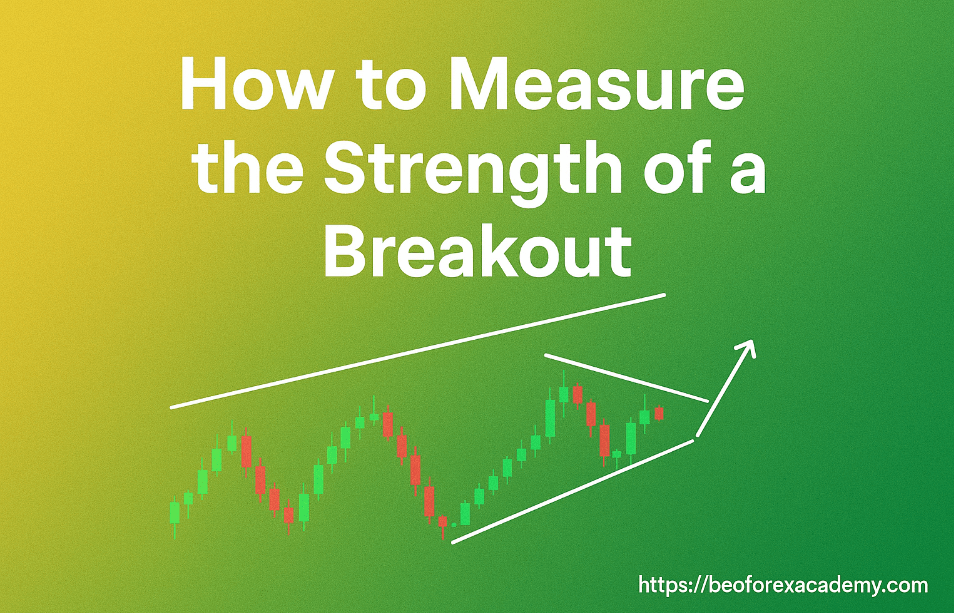
Trading breakouts when the price moves decisively outside a defined support or resistance area is one of the most profitable strategies in technical analysis. However, the majority of initial penetrations are false breakouts (fakeouts).
To succeed, a trader must be able to quickly and accurately measure the conviction behind a breakout. This guide breaks down the three essential methods for confirming the strength of a new move.
In This Post
Candlestick and Price Action Confirmation
The most immediate clues about a breakout’s strength come directly from the candlestick that penetrates the boundary.
Decisive Body Close
The single most critical factor is where the closing price lands relative to the broken barrier (e.g., a trend line, channel, or horizontal support/resistance).
- Strong Breakout: The candlestick should close significantly outside the structure, with only a small portion of the body (or none at all) remaining inside the previous boundary. The further the close is from the line, the stronger the move.
- Weak Breakout (High Risk): If the candle closes near the boundary, or only slightly outside it, the move is weak and susceptible to quick reversal.
Minimal Wicks (Low Rejection)
The length of the wick (or shadow) tells you how aggressively the opposing forces (buyers vs. sellers) responded to the move.
- Strong Breakout: The breakout candle should be a large, full-bodied candle (like a Marubozu or a strong Engulfing candle) with very short wicks in the direction of the break. This indicates that the momentum was unchallenged.
- Weak Breakout: A long wick that pulls the price back toward or across the broken line is a sign of rejection and weakness. For instance, a bearish breakout with a long lower wick shows buyers immediately stepped in to push the price back up.
Timeframe Integrity
The conviction must be confirmed on higher timeframes.
- A breakout on a 15-minute chart is low-conviction.
- A breakout confirmed by a decisive close on the 4-hour or Daily chart shows significantly higher commitment from institutional traders, making the move much more reliable.
Volume and Momentum Validation
For markets where volume data is readily available (stocks, futures, crypto), volume confirmation is the gold standard. For Forex, momentum indicators serve as an excellent proxy.
Spike in Trading Volume
- Strong Breakout: A valid breakout must be accompanied by a noticeable and significant increase in trading volume compared to the average volume during the prior consolidation phase. This confirms that genuine institutional participation (large orders) is driving the move.
- Weak Breakout: If the breakout occurs on low or average volume, it is likely driven by short-term traders or random fluctuation, making it an ideal candidate for a fakeout.
Momentum Indicator Confirmation
In Forex and other markets, momentum indicators help gauge the speed and power of the price move:
- Average Directional Index (ADX): The ADX should rise sharply and move above the 25 level during the breakout. This confirms that a strong new trend is beginning. If the ADX is falling or flat, the breakout lacks trend strength.
- RSI (Relative Strength Index): The RSI should move quickly into or beyond the overbought (above 70) or oversold (below 30) zones in the direction of the breakout, indicating overwhelming pressure.
The Quality of the Pullback (The Re-test)
The subsequent price action immediately following the initial breakout often offers the clearest signal of strength. The highest-probability trades occur when the market respects the concept of Support/Resistance Flip.
The Re-test and Rejection
- Strong Breakout: The price breaks out, moves away decisively, and then returns for a shallow, quick pullback (re-test) to the broken level. Crucially, the broken resistance (now support) or broken support (now resistance) holds, and the price reverses sharply to continue the breakout direction. This validates the strength of the new barrier.
- Weak Breakout: The price either pulls back too deeply, momentarily re-entering the original structure, or it consolidates weakly right on top of the broken level before falling back inside the pattern.
Velocity of the Pullback
- Strong Breakout: The pullback itself should be slow and orderly, often characterized by small, overlapping candles. This indicates exhaustion of opposing traders (e.g., those who missed the break and are taking profits).
- Weak Breakout: A sharp, rapid pullback to the broken level suggests strong selling or buying pressure is still active, making the area vulnerable to a complete reversal back into the pattern.
Frequently Asked Questions (FAQs)
What is the minimum distance a candle should close outside the barrier to be considered “decisive”?
- There is no fixed pixel value, but a good rule of thumb is that the close should be at least 1 Average True Range (ATR) distance away from the broken line on the relevant timeframe. This suggests the move is greater than the typical market noise.
Is trading the initial breakout or the re-test safer?
- Trading the re-test (pullback) is almost always safer. The initial breakout offers the highest reward (getting in early) but has the highest risk of being a fakeout. The re-test confirms that the broken level has truly flipped its role (resistance to support, or vice versa), offering a lower-risk entry with a tighter stop loss.
How do false breakouts often look?
- False breakouts are usually characterized by two main features: 1) A long wick that penetrates the barrier but the body closes back inside the structure, or 2) The breakout candle closes outside, but the very next candle immediately reverses direction and closes back inside the structure.
If I don’t have volume data, what is the best alternative confirmation?
- If you are trading Forex or another market lacking reliable centralized volume data, rely heavily on Candlestick and Momentum analysis. Specifically, look for large, full-bodied engulfing candles on the breakout, and confirmation that the ADX is spiking above 25.
How many times should a level be tested before the breakout is considered reliable?
- The more times a level (be it a trend line, channel, or horizontal line) is successfully touched and held before the breakout, the stronger the conviction when it finally breaks. A level tested three or more times builds significant energy, and its eventual break is usually explosive and highly reliable.





