


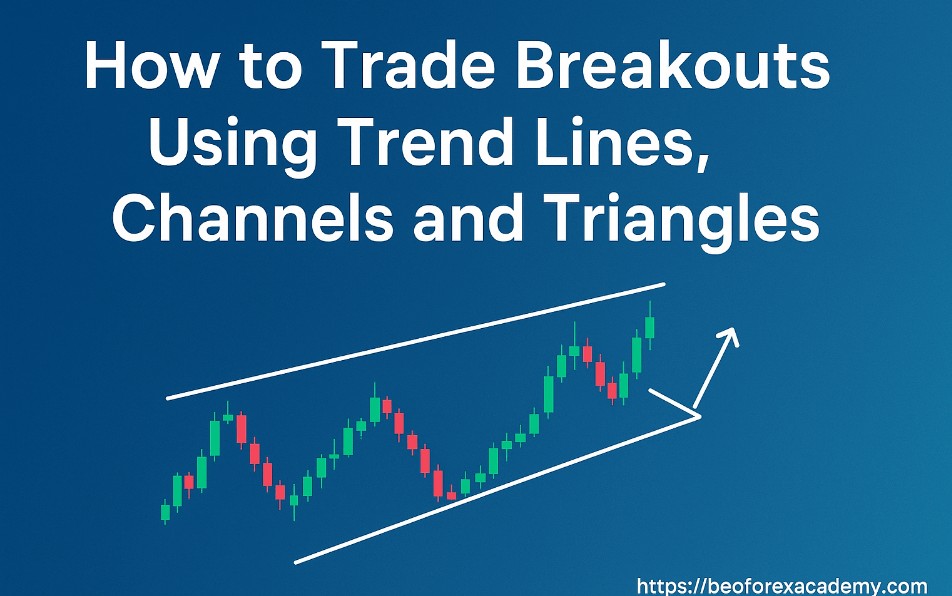
Trading breakouts is a high-reward strategy that aims to capture explosive price movements when a market moves outside a period of defined stability. While the concept is simple,buy high or sell low when a barrier breaks the execution requires precision, as false breakouts (fakeouts) are common.
This guide focuses on trading the three most common and reliable patterns for breakout execution in Forex: Trend Lines, Channels, and Triangles.
In This Post
Trading Trend Line Breakouts
A trend line acts as a dynamic level of support or resistance for an existing trend. A decisive break of this line often signals a shift in market control, potentially leading to a reversal or a prolonged period of consolidation.
Identifying the Opportunity
- In an Uptrend: Draw a line connecting at least two, preferably three, higher lows (HL). This upward-sloping line acts as dynamic support.
- In a Downtrend: Draw a line connecting at least two, preferably three, lower highs (LH). This downward-sloping line acts as dynamic resistance.
Execution Strategy
- Entry (The Break): A potential entry is triggered when a candle closes convincingly beyond the trend line.
- Confirmation (The Re-test): The highest probability trade occurs when the price breaks the trend line, moves away, and then returns to re-test the broken line (which now acts as its opposite support becomes resistance, and vice versa). This is the safest entry point.
- Stop Loss: Place the stop loss on the opposite side of the trend line, just beyond the last swing point before the breakout.
- Target: Measure the distance from the high of the trend to the lowest swing point and project that distance from the breakout point.
Trading Channel Breakouts
A price channel is formed by two parallel trend lines that contain the price movement. This pattern represents a period where the market is trending but with established boundaries, usually leading to continuation breakouts.
Identifying the Opportunity
- Parallel Lines: Identify two lines that are parallel to each other, connecting the highs and the lows of the price action.
- Continuation: A strong, established trend precedes the channel. The breakout typically occurs in the direction of that prior trend.
Execution Strategy
- The Wait: The price should bounce off both the upper and lower channel lines multiple times, confirming the channel’s validity.
- Entry: Wait for a decisive close outside the channel line in the direction of the primary trend. For a bull flag (an upward trend with a downward channel), the breakout is above the upper resistance line.
- Stop Loss: Place the stop loss on the opposite side of the broken channel line, often in the middle of the channel or just inside the pattern.
- Target (Measured Move): The most common target is calculated by measuring the vertical height of the channel (or the preceding swing move) and projecting that distance from the point of the breakout.
Trading Triangle Breakouts
Triangles, also known as wedges or pennants, are consolidation patterns that signify market indecision where volatility is contracting. As the price moves closer to the apex (the point where the lines converge), the pressure builds, leading to a high-energy breakout.
There are three main types of triangles:
Symmetrical Triangle
This pattern has a descending resistance line and an ascending support line, indicating that both buyers and sellers are becoming less aggressive. The breakout can happen in either direction.
Ascending Triangle
This is a bullish continuation pattern. It has a flat horizontal resistance line and an ascending support line. The flat top shows strong selling at a specific price, but the ascending support shows buyers are stepping in at ever-higher lows. The expectation is a break above the resistance.
Descending Triangle
This is a bearish continuation pattern. It has a flat horizontal support line and a descending resistance line. The flat bottom shows strong buying at a specific price, but the descending resistance shows sellers are entering at ever-lower highs. The expectation is a break below the support. [Image illustrating Ascending, Descending, and Symmetrical Triangle patterns and their respective breakouts]
Execution Strategy for Triangles
- Entry: Wait for a close above the resistance line (for ascending) or below the support line (for descending). Volume confirmation is especially crucial here.
- Stop Loss: Place the stop loss just inside the triangle pattern, typically beyond the last swing point opposite the breakout direction.
- Target (Measured Move): Measure the height of the widest part of the triangle (the base) and project that distance from the breakout point.
Essential Breakout Rules for All Patterns
Regardless of the pattern you are trading, adherence to these principles will dramatically increase your success rate and manage your risk:
Wait for the Close
Never enter on a wick or penetration. Wait for the candlestick to close entirely outside the structure line on your selected timeframe. This is crucial as it prevents getting trapped by immediate false moves and market noise (fakeouts).
Volume/Momentum Confirmation
A valid breakout should be accompanied by a noticeable increase in trading volume or acceleration in momentum (confirmed by indicators like ADX). This ensures the move is driven by genuine institutional participation, not random fluctuation.
Strict Risk Management
Always calculate your position size so that your stop loss, if hit, results in a loss of no more than 1% to 2% of your total trading capital. This preserves capital and ensures survival during inevitable losses.
Frequently Asked Questions (FAQs)
What is the most reliable confirmation technique for a breakout?
- The most reliable confirmation is the re-test (or pullback). When price breaks, moves away, and then returns to kiss the broken level before continuing, it validates the strength of the new support/resistance. Entering on the re-test minimizes risk and increases the odds of success.
How can I differentiate a “false breakout” (fakeout) from a real one?
- A false breakout often features a single candle wick or a quick reversal back inside the pattern immediately after penetration. Real breakouts are often accompanied by strong momentum, high volume, and result in the subsequent candles remaining outside the broken zone. If the price fails to hold the broken level, assume it’s a fakeout.
Why do traders use the height of the pattern to determine the target?
- The height of a consolidation pattern (like a channel or triangle base) represents the total energy or pressure built up during the consolidation phase. Once the breakout occurs, that stored energy is often released, and the subsequent price move tends to travel a distance roughly equal to the pattern’s height. This is known as the “measured move.”
Are there specific indicators that work well with breakout strategies?
- Yes. The ADX (Average Directional Index) is crucial as it measures trend strength. A strong breakout should see the ADX rise above 25. Additionally, using a simple Moving Average (like the 50 or 200 EMA) can help confirm the larger trend direction before taking a continuation breakout trade.
Should I trade continuation or reversal breakouts?
- Continuation breakouts (e.g., breaking out of a flag in the direction of the original trend) are generally considered safer and higher probability. Reversal breakouts (e.g., a diagonal trend line break) carry higher risk because you are betting against the established momentum. Beginners should focus on continuation patterns first.





