


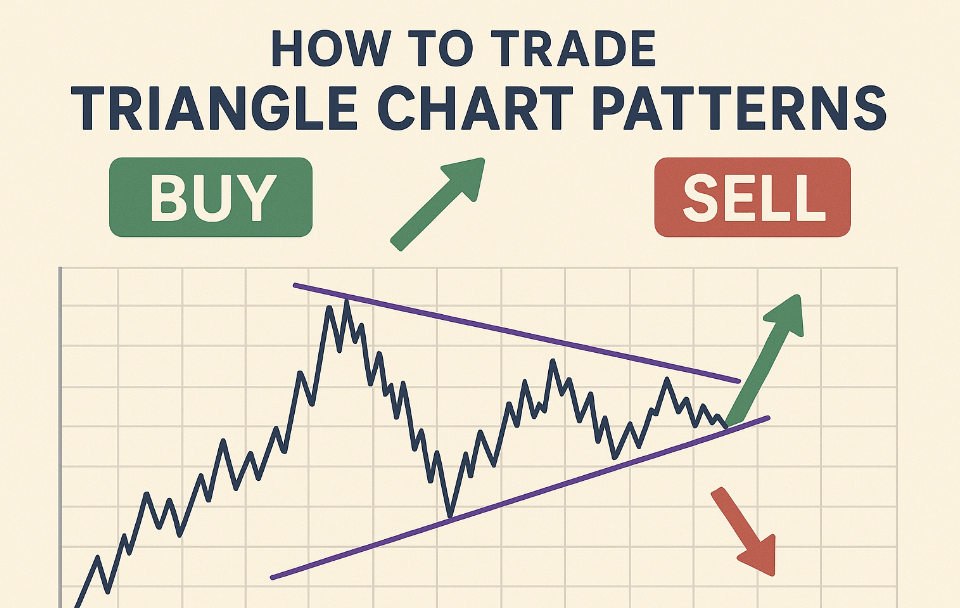
The Triangle Chart Pattern is a widely recognized formation that signals a contraction of price movement, indicating a period of market indecision and decreasing volatility. As the price tightens into the apex of the triangle, the stage is set for an explosive breakout move, often initiating the next major phase of the trend.
Understanding the three primary types of triangles—Symmetrical, Ascending, and Descending, allows traders to anticipate the most likely direction and set high-probability entry points and targets.
In This Post
Understanding the Three Types of Triangle Patterns
All triangle patterns are characterized by converging trend lines, but the slope of these lines dictates the market psychology and the likely direction of the eventual breakout.
The Symmetrical Triangle: Neutral Indecision
The symmetrical triangle is the most common type and signals pure indecision between buyers and sellers.
- Structure: It is formed by a down-sloping upper trend line (resistance) connecting lower swing highs and an up-sloping lower trend line (support) connecting higher swing lows.
- Market Psychology: This pattern represents a balanced fight. The pressure is building equally from both sides, making it a true continuation pattern, it usually breaks out in the direction of the preceding trend.
The Ascending Triangle: Bullish Pressure
The ascending triangle is a fundamentally bullish pattern, signaling that buyers are more aggressive than sellers.
- Structure: It is defined by a flat (horizontal) upper trend line (resistance) and an up-sloping lower trend line (support) connecting higher swing lows.
- Market Psychology: The flat resistance shows that sellers are defending a specific price level, but the higher lows indicate buyers are willing to step in at increasingly higher prices. The pressure mounts until resistance is broken to the upside.
The Descending Triangle: Bearish Pressure
The descending triangle is a fundamentally bearish pattern, signaling that sellers are dominating the market.
- Structure: It is defined by a flat (horizontal) lower trend line (support) and a down-sloping upper trend line (resistance) connecting lower swing highs.
- Market Psychology: The flat support shows that buyers are defending a specific price level, but the lower highs indicate sellers are forcing the price down at every rally attempt. The pressure mounts until support is broken to the downside.
How to Identify Triangle Patterns
Accurate identification is crucial to avoid fakeouts. Follow these rules:
Core Identification Rules
- Two Converging Trendlines: Upper and lower lines slope toward each other
- At Least 5 Touches: 2–3 per trendline
- Duration: 3–12 weeks (shorter on intraday charts)
- Volume: Decreases during formation, spikes on breakout
- Preceding Trend: Strong move before consolidation
Timeframe Guidelines
- Strongest on H4, Daily, Weekly
- Intraday triangles (M15–H1) need high-volume assets
- Avoid triangles with fewer than 4 touches
Ascending Triangle vs Descending Triangle vs Symmetrical Triangle
Each type has unique bias and structure:
- Ascending Triangle (Bullish):
- Flat upper resistance, rising lower support
- Forms in uptrends
- Breakout above resistance
- Target: Height added to breakout
- Descending Triangle (Bearish):
- Flat lower support, falling upper resistance
- Forms in downtrends
- Breakout below support
- Target: Height subtracted from breakout
- Symmetrical Triangle (Neutral):
- Converging upper (lower highs) and lower (higher lows)
- Forms in any trend
- Breakout either direction (volume decides)
- Target: Height added/subtracted from breakout
Step-by-Step: How to Trade Ascending Triangle (Bullish)
1. Confirm Pattern
- Uptrend before consolidation
- Flat resistance (2+ touches)
- Rising support (2+ touches)
- Volume drops inside triangle
2. Entry Strategies
- Breakout Entry: Long on candle close above resistance
- Pullback Entry: Buy on retest of broken resistance as support
- Aggressive Entry: Buy near support with bullish candle
3. Stop-Loss
- Below rising support or recent swing low
- Add 1–2% buffer
4. Take-Profit Target
- Measure maximum height (widest part)
- Add to breakout point
- Example: Base $100, Resistance $120 → Height = $20 Breakout at $120.50 → Target = $140.50
Step-by-Step: How to Trade Descending Triangle (Bearish)
1. Confirm Pattern
- Downtrend precedes formation
- Flat support (2+ touches)
- Falling resistance (2+ touches)
- Volume fades
2. Entry Strategies
- Breakout Entry: Short on candle close below support
- Pullback Entry: Short on retest as resistance
- Aggressive Entry: Short near resistance
3. Stop-Loss
- Above falling resistance or recent swing high
4. Take-Profit Target
- Measure triangle height
- Subtract from breakout
- Example: Resistance $80, Support $60 → Height = $20 Breakout at $59.50 → Target = $39.50
Step-by-Step: How to Trade Symmetrical Triangle
1. Confirm Pattern
- Converging lower highs and higher lows
- Volume declines
- Check higher timeframe bias
2. Entry Strategies
- Breakout Entry: Trade in direction of breakout (up or down)
- Pullback Entry: Wait for retest
- Avoid Aggressive Entries (50/50 bias)
3. Stop-Loss
- Opposite side of triangle or recent swing
4. Take-Profit Target
- Measure widest height
- Add/subtract from breakout point
Best Confirmation Tools for Triangle Breakouts
Boost accuracy with:
- Volume Spike (2–3x average)
- RSI Breakout (>50 bullish, <50 bearish)
- MACD Crossover
- Candlestick Confirmation (engulfing, pin bar)
- Fibonacci 61.8% alignment
5 Common Mistakes When Trading Triangles
- Entering before breakout
- Ignoring volume
- Tight stops inside triangle
- Trading without prior trend
- Confusing with wedges (no flat side)
Real-World Example: Ascending Triangle in NG/USD (Natural Gas)
Daily Chart:
- Uptrend from $2.20 → consolidates
- Resistance: $2.80 (4 touches)
- Rising support: $2.50 → $2.70
- Volume drops 75%, spikes on breakout
Trade:
- Long at $2.81
- Stop: $2.68
- Target: $2.81 + ($2.80 – $2.50) = $3.11 → $0.30 profit, 1:2.3 risk-reward
Triangle Breakout Success Rate and Pro Tips
- Success Rate: 70–80% with volume + trend
- Best Assets: Forex majors, energy, tech stocks
- Pro Tips:
- Wait for candle close beyond level
- Use limit orders
- Take partial profits at 50%
- Avoid triangles near news events
Mastering how to trade triangle chart patterns gives you a high-probability breakout system. Focus on clean convergence, volume confirmation, and measured targets. Combine with RSI and price action for elite accuracy. Practice identifying 50+ triangles on historical charts using TradingView or MetaTrader. With discipline, triangles can become your most reliable pattern.
Frequently Asked Questions
How long should a triangle pattern last to be reliable?
- Generally, a triangle should take at least two to three weeks to form on a daily chart. The price should ideally break out somewhere between 50% and 75% of the way toward the apex. If the price reaches the apex without breaking out, the pattern loses its predictive power and often resolves with a slow, insignificant move.
Is the Symmetrical Triangle always a continuation pattern?
- While the symmetrical triangle most often acts as a continuation pattern (breaking out in the direction of the prior trend), it can occasionally signal a reversal. Therefore, unlike the ascending and descending triangles, you should not pre-emptively assume a direction with the symmetrical pattern. You must strictly wait for a confirmed breakout to define your trade direction.
What is a “false breakout” and how can I avoid it?
A false breakout occurs when the price briefly moves outside the triangle only to quickly reverse and move back inside. This usually traps traders who entered too early. You can reduce the risk of false breakouts by:
- Waiting for the candle close: Do not trade based on intraday spikes.
- Requiring high volume: A high-volume spike confirms genuine market interest.
- Using the conservative entry: Waiting for a re-test often filters out the failed early attempts.
How do I calculate the base measurement for the target?
- The base is the vertical height of the triangle measured at its widest point, which is the far left side where the formation begins. You simply measure the distance between the first swing high and the first swing low that defines the initial range of the triangle.
How do I use these patterns on different timeframes?
- Triangle patterns work reliably on all timeframes, but their significance scales up with the timeframe. A triangle forming on a weekly chart suggests a major, multi-month move is pending. A triangle on a 15-minute chart suggests an intraday move that may last for a few hours. Always use the timeframe you are trading to set your target and stop-loss.





