


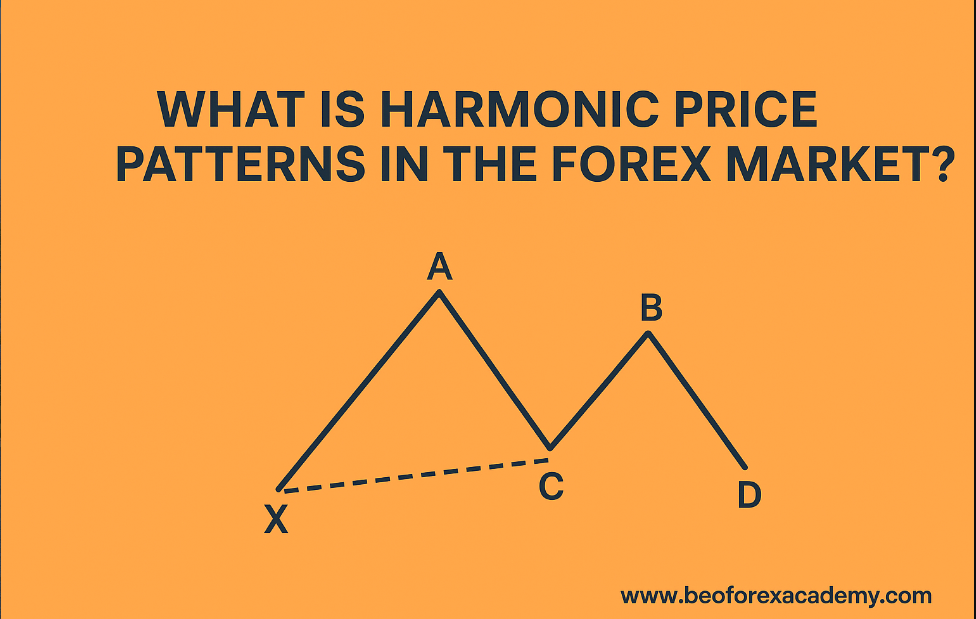
Harmonic price patterns are advanced geometric chart formations that use specific Fibonacci ratios to identify high-probability reversal zones in the forex market. Unlike classic patterns (head & shoulders, triangles), harmonic patterns rely on precise ratio alignments to predict where price will reverse with remarkable accuracy. Traders in forex pairs like EUR/USD, GBP/USD, and USD/JPY use harmonics to find potential reversal zones (PRZ) for entries with tight stops and excellent risk-reward ratios.
In This Post
What Are Harmonic Price Patterns?
Harmonic patterns are 5-point (or 6-point) price structures that incorporate Fibonacci retracement and extension levels to define turning points. They were popularized by H.M. Gartley in 1935 and later refined by Larry Pesavento and Scott Carney.
The core idea:
Markets move in repetitive geometric patterns driven by trader psychology → these patterns create confluence zones where multiple Fibonacci ratios align → high-probability reversals occur.
All harmonic patterns consist of:
- X-A-B-C-D points
- Strict Fibonacci ratio requirements for each leg
- A Potential Reversal Zone (PRZ) where the pattern completes
When price reaches the PRZ, traders look for reversal candlesticks or indicators (RSI divergence) to enter.
The 5 Main Harmonic Price Patterns
1. Gartley Pattern (The Original)
- Bullish: M-shaped → buy at D
- Bearish: W-shaped → sell at D
- Ratios:
- AB = 61.8% of XA
- BC = 38.2–88.6% of AB
- CD = 78.6% of XA
- Most reliable and common
2. Butterfly Pattern
- Extended version of Gartley
- D point goes beyond X (127.2% or 161.8% extension of XA)
- Very strong reversal signal at extremes
3. Bat Pattern
- Tighter ratios than Gartley
- AB = 38.2–50% of XA
- CD = 88.6% of XA
- One of the most accurate patterns
4. Crab Pattern
- Most extreme harmonic pattern
- BC = 38.2–61.8% of AB
- CD = 161.8% extension of XA
- Deep Crab variant uses 224–361.8%
5. Shark Pattern
- Newer pattern (Scott Carney)
- Uses 113% and 161.8–200% extensions
- Aggressive reversal setup
Other patterns include Cypher, 5-0, and AB=CD.
How Harmonic Patterns Work with Fibonacci
Every leg must meet specific retracement/extension ratios:
- 0.618, 0.786, 1.272, 1.618 are the most important
- The PRZ is formed when multiple Fibonacci levels converge
- The more ratios that align at D → the stronger the reversal
Example PRZ confluence:
- 78.6% retracement of XA
- 127.2% extension of BC
- 161.8% extension of AB
Step-by-Step: How to Identify Harmonic Patterns
- Identify X-A swing (major high/low)
- Wait for A-B retracement (usually 61.8%)
- Measure B-C projection
- Project C-D completion using Fibonacci tool
- Confirm PRZ confluence (3+ ratios)
- Wait for reversal candle or indicator confirmation at D
Tools: ZUP, Harmonic Pattern indicators on TradingView/MT4.
How to Trade Harmonic Patterns in Forex
Bullish Harmonic Setup
- Pattern completes at D (support)
- Enter long on bullish candle close
- Stop-loss: 5–15 pips below X (or D extension)
- Take-profit: 38.2% and 61.8% retracement of CD
Bearish Harmonic Setup
- Pattern completes at D (resistance)
- Enter short on bearish candle
- Stop above X
- Targets at 38.2% / 61.8% of CD
Risk-Reward: Usually 1:2 to 1:5 — excellent.
Advantages and Limitations
Advantages:
- Very high accuracy when rules followed
- Precise entries and stops
- Works on all timeframes (H1, H4, Daily best)
Limitations:
- Subjective (ratios must be exact)
- Repainting indicators
- Requires patience (rare setups)
- Fails in strong trending markets
Real-World Example: Bullish Bat on EUR/USD (2024)
- X-A: 1.0500 → 1.1200
- A-B: Retraced to 1.0800 (50%)
- B-C: Projected to 1.1000
- C-D: Completed at 1.0650 (88.6% of XA + 161.8% of BC) → Price reversed sharply to 1.1000+ (400-pip move)
Frequently Asked Questions
Are harmonic patterns reliable in forex?
- Yes, when all Fibonacci ratios align and you wait for confirmation, accuracy can reach 70–80%.
Which harmonic pattern is the most accurate?
- Bat and Crab patterns have the highest success rate due to tight ratios.
Do harmonic patterns work on all timeframes?
- Best on H4 and Daily. Lower timeframes (M15–H1) have more noise and false signals.
Can I automate harmonic pattern detection?
- Yes,use indicators like ZUP, Harmonic Pattern Plus, or TradingView scripts. Always verify manually.
What’s the difference between Gartley and Butterfly?
- Gartley completes inside XA (78.6%). Butterfly extends beyond X (127–161.8%). Butterfly is more aggressive.





