


In the world of financial trading, understanding support and resistance levels is essential for making informed decisions. These concepts form the backbone of technical analysis, helping traders predict potential price movements in stocks, forex, cryptocurrencies, and other assets. Whether you’re a novice investor or an experienced trader, grasping what support and resistance are can significantly improve your strategy. In this article, we’ll break down these terms, explain how they work, and provide practical tips on identifying them.
In This Post
Understanding Support in Trading
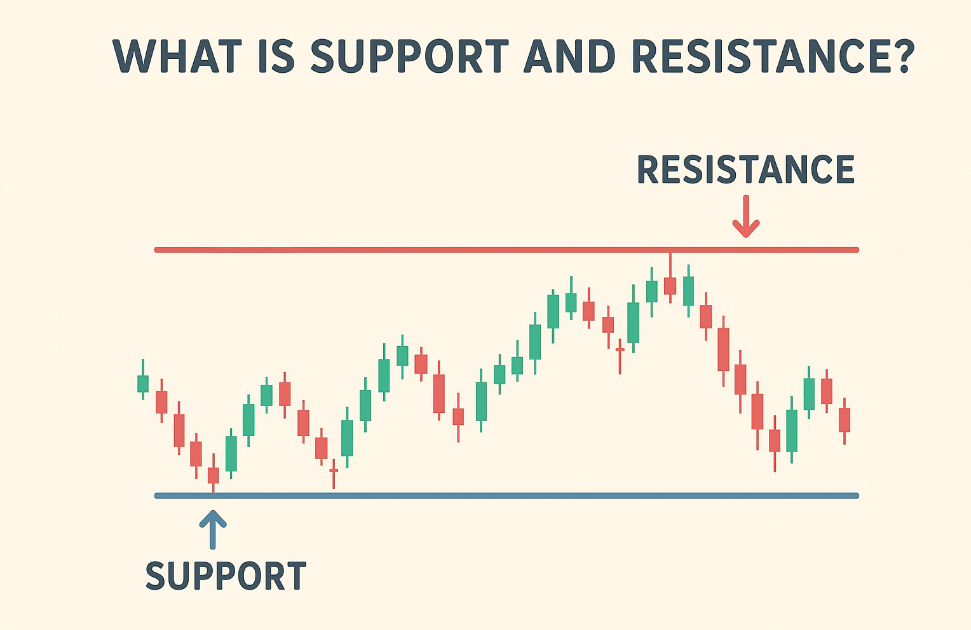
Support refers to a price level where a downtrending asset tends to find buying interest, preventing it from falling further. Think of it as a “floor” where the price bounces off. When an asset’s price approaches this level, buyers step in, believing the asset is undervalued, which increases demand and pushes the price back up.
For example, if a stock has repeatedly bounced back from $50 over several months, $50 becomes a strong support level. Traders often use this information to set buy orders or stop-losses just below support to manage risk.
Key characteristics of support levels:
- They are formed by historical price lows.
- Volume often increases at support, indicating strong buyer interest.
- Support can be horizontal (straight line) or dynamic (trendlines or moving averages).
What is Resistance in Trading?
On the flip side, resistance is a price level where an uptrending asset encounters selling pressure, halting its upward momentum. It’s like a “ceiling” that the price struggles to break through. Sellers dominate at this point, viewing the asset as overvalued, which leads to increased supply and a potential price reversal downward.
If a cryptocurrency like Bitcoin has failed to exceed $60,000 multiple times, that level acts as resistance. Breaking through resistance often signals a bullish trend continuation.
Notable features of resistance levels:
- They arise from historical price highs.
- Trading volume may spike as sellers enter the market.
- Like support, resistance can be static or dynamic, often visualized with trendlines.
How Support and Resistance Work Together
Support and resistance aren’t isolated; they interact dynamically in the market. A key principle is that once broken, support can become resistance, and vice versa. For instance, if a price breaks above a resistance level, that former resistance might now act as support on pullbacks.
This role reversal is crucial for traders using breakout strategies. Markets often move in ranges between support and resistance until a significant event like economic news or earnings reports causes a breakout. Visualizing these levels on charts helps traders anticipate reversals or continuations. Tools like candlestick patterns (e.g., doji or hammer) near these levels can confirm potential bounces or breaks.
How to Identify Support and Resistance Levels
Identifying support and resistance requires practice and the right tools. Here’s a step-by-step guide:
- Use Historical Data: Look at past price charts to spot where the asset has reversed multiple times. The more touches a level has, the stronger it is.
- Draw Trendlines: Connect swing lows for support or swing highs for resistance. Upward-sloping support indicates an uptrend, while downward-sloping resistance signals a downtrend.
- Incorporate Moving Averages: Popular ones like the 50-day or 200-day moving average often act as dynamic support or resistance.
- Fibonacci Retracements: These levels (e.g., 38.2%, 61.8%) based on the Fibonacci sequence help pinpoint potential support/resistance in trending markets.
- Psychological Levels: Round numbers like $100 or 1.0000 in forex often serve as mental barriers for traders.
Pro Tip: Use charting platforms like TradingView or MetaTrader to automate some of this. Always confirm with multiple timeframes, daily charts for long-term levels and hourly for short-term.
The Importance of Support and Resistance in Trading Strategies
Why bother with support and resistance? These levels help in:
- Risk Management: Place stop-loss orders just beyond support/resistance to limit losses.
- Entry and Exit Points: Buy near support, sell near resistance, or trade breakouts.
- Trend Analysis: They reveal whether a market is ranging, trending up, or down.
- Combining with Indicators: Pair with RSI (Relative Strength Index) or MACD for stronger signals.
Ignoring these can lead to emotional trading decisions. Studies show that strategies incorporating support/resistance outperform random entries by reducing false signals.
Real-World Examples of Support and Resistance
Consider Apple Inc. (AAPL) stock in 2023: It found support around $150 during pullbacks, bouncing multiple times before breaking resistance at $180, leading to new highs. In forex, EUR/USD often respects the 1.0800 support level, where buyers defend it amid economic uncertainties. Cryptocurrencies like Ethereum exhibit volatile support/resistance, with levels like $2,000 acting as pivotal points during bull runs.
Common Mistakes When Using Support and Resistance
- Over-Reliance on One Level: Markets evolve; old levels may weaken.
- Ignoring Volume: Low-volume breaks are often false.
- Neglecting News Events: Fundamentals can shatter technical levels.
- Drawing Too Many Lines: Cluttered charts lead to analysis paralysis.
- Emotional Bias: Don’t force levels where they don’t exist.
Support and resistance are foundational tools in technical analysis, offering insights into market psychology and potential price action. By learning to identify and apply them, you can enhance your trading edge. Remember, no tool is foolproof—combine with other analyses and practice on demo accounts. Start charting today to see these concepts in action.
Frequently Asked Questions (FAQs)
What is the difference between support and resistance?
- Support is a lower price level where buying interest prevents further declines, while resistance is an upper level where selling pressure halts upward moves. They act as barriers in price charts.
How do I find support and resistance on a chart?
- Look for historical highs/lows, draw trendlines connecting swing points, or use indicators like moving averages and Fibonacci retracements. Multiple touches strengthen a level.
Can support become resistance?
- Yes, once a price breaks below support, that level can turn into resistance on future rallies. The reverse holds true for broken resistance becoming support.
Are support and resistance reliable in all markets?
- They work across stocks, forex, crypto, and commodities but are more reliable in liquid markets. Always consider volatility and external factors like news.
What happens when price breaks through resistance?
- A breakout above resistance often signals a bullish continuation, potentially leading to new highs. Traders might enter long positions with stops below the former resistance.

