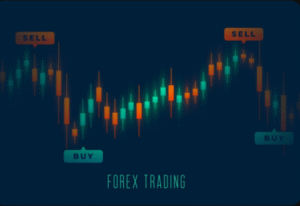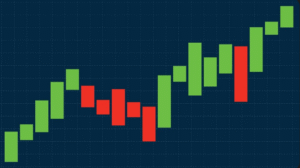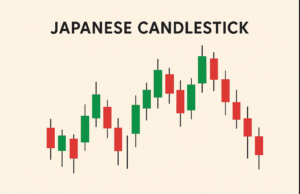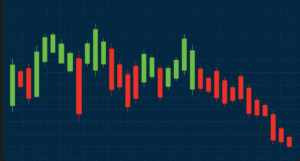
Single Candlestick Patterns
Single candlestick patterns are a foundational element of technical analysis, offering traders quick and actionable insights into market sentiment and potential price movements. Originating from Japanese rice traders in the 18th century, these patterns are widely used today across markets