


Japanese candlesticks are a cornerstone of technical analysis, widely used by traders to interpret price movements in markets like stocks, forex, cryptocurrencies, and commodities. Originating in Japan in the 18th century, these charts were popularized by rice trader Munehisa Homma and remain a vital tool for modern traders. Understanding the anatomy of a Japanese candlestick is key to unlocking its potential for identifying trends, reversals, and market sentiment.
In this article, we’ll break down the anatomy of a Japanese candlestick, explain its components, and explore how traders use it to make informed decisions. We’ll also answer five frequently asked questions to clarify common doubts.
In This Post
What is a Japanese Candlestick?
A Japanese candlestick is a graphical representation of an asset’s price movement over a specific time period, such as a minute, hour, day, or week. Each candlestick provides a snapshot of four critical price points:
- Open: The price at the beginning of the time period.
- Close: The price at the end of the time period.
- High: The highest price reached during the period.
- Low: The lowest price reached during the period.
These data points form the structure of the candlestick, which consists of a body and wicks (also called shadows). By analyzing these components, traders gain insights into market dynamics and potential price directions.
The Anatomy of a Japanese Candlestick
To fully understand Japanese candlesticks, let’s dissect their key components:
1. The Body
The body of a candlestick represents the price range between the open and close prices during the chosen time period. It is typically displayed as a rectangular shape and is color-coded to indicate market direction:
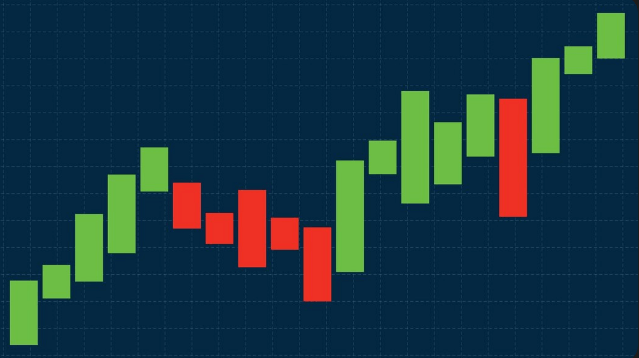
- Bullish Candle: When the closing price is higher than the opening price, the body is usually green or white, signaling buying pressure and upward price movement.
- Bearish Candle: When the closing price is lower than the opening price, the body is typically red or black, indicating selling pressure and downward price movement.
The size of the body reflects the strength of the price movement. A long body suggests strong buying or selling pressure, while a short body indicates indecision or consolidation.
2. The Wicks (Shadows)
The wicks, or shadows, are the thin lines extending above and below the body. They represent the high and low prices during the time period:
- Upper Wick: The line above the body, showing the highest price reached.
- Lower Wick: The line below the body, indicating the lowest price reached.
Long wicks can signal rejection of higher or lower prices, while short wicks may indicate limited price volatility. For example, a long upper wick on a bullish candle suggests that buyers pushed prices up but faced resistance, causing a pullback.
3. Candlestick Types
The combination of body and wick sizes creates various candlestick types, each with unique implications:
- Doji: A candlestick with a very small body (open and close prices are very close), signaling market indecision.
- Marubozu: A candlestick with a long body and little to no wicks, indicating strong bullish or bearish momentum.
- Hammer: A bullish candle with a small body and a long lower wick, often signaling a potential reversal at the bottom of a downtrend.
- Shooting Star: A bearish candle with a small body and a long upper wick, often appearing at the top of an uptrend.
Why Understanding Candlestick Anatomy Matters
Mastering the anatomy of Japanese candlesticks allows traders to:
- Read Market Sentiment: The body and wicks reveal whether buyers or sellers are in control.
- Identify Key Patterns: Recognizing candlestick shapes helps spot trends, reversals, or continuations.
- Make Informed Decisions: Combining candlestick analysis with other indicators enhances trading accuracy.
- Apply Across Markets: Candlestick anatomy is universal, applicable to forex, stocks, crypto, and more.
How Traders Use Candlestick Anatomy
Traders leverage candlestick anatomy in several ways:
- Trend Analysis: A series of bullish or bearish candles with consistent bodies indicates a strong trend.
- Reversal Signals: Patterns like Hammers or Shooting Stars, identified by their wick and body structure, suggest potential reversals.
- Support and Resistance: Long wicks at key price levels often indicate support or resistance zones.
- Confirmation with Indicators: Pairing candlestick analysis with tools like RSI, MACD, or Bollinger Bands strengthens trade setups.
4 Benefits of Japanese Candlestick Analysis
- Visual Clarity: Candlesticks present price data in an easy-to-read format.
- Historical Reliability: Used for centuries, candlesticks have proven effective in various markets.
- Versatility: Applicable to all timeframes, from scalping to long-term investing.
- Pattern Recognition: The anatomy enables traders to identify actionable patterns like Doji, Engulfing, or Morning Star.
Frequently Asked Questions
What does the body of a Japanese candlestick represent?
- The body of a Japanese candlestick shows the price range between the opening and closing prices during a specific time period. A green or white body indicates a bullish candle (close higher than open), while a red or black body indicates a bearish candle (close lower than open).
What are the wicks in a candlestick, and why are they important?
- Wicks, or shadows, are the thin lines above and below the candlestick body, representing the highest and lowest prices during the time period. They are important because they show price extremes and can indicate rejection levels or market indecision.
What is a Doji candlestick, and how is its anatomy different?
- A Doji candlestick has a very small body, where the opening and closing prices are nearly identical. Its anatomy often includes longer wicks, signaling market indecision and potential trend reversals or continuations.
How can the size of a candlestick’s body affect trading decisions?
- A large candlestick body indicates strong buying or selling pressure, suggesting a continuation of the trend. A small body signals indecision or consolidation, often prompting traders to wait for confirmation before acting.
Can candlestick anatomy be used in all financial markets?
- Yes, the anatomy of Japanese candlesticks is universal and can be applied to any market with price data, including stocks, forex, cryptocurrencies, commodities, and indices, across various timeframes.

