


Support and Resistance are crucial concepts in Technical Analysis, indicating key price levels where supply and demand have historically shifted, leading to price reversals. Understanding and trading these levels is vital for identifying high-probability entry points and managing risk. Support and Resistance embodies the collective behavior and memory of market participants, influencing trading decisions.
In This Post
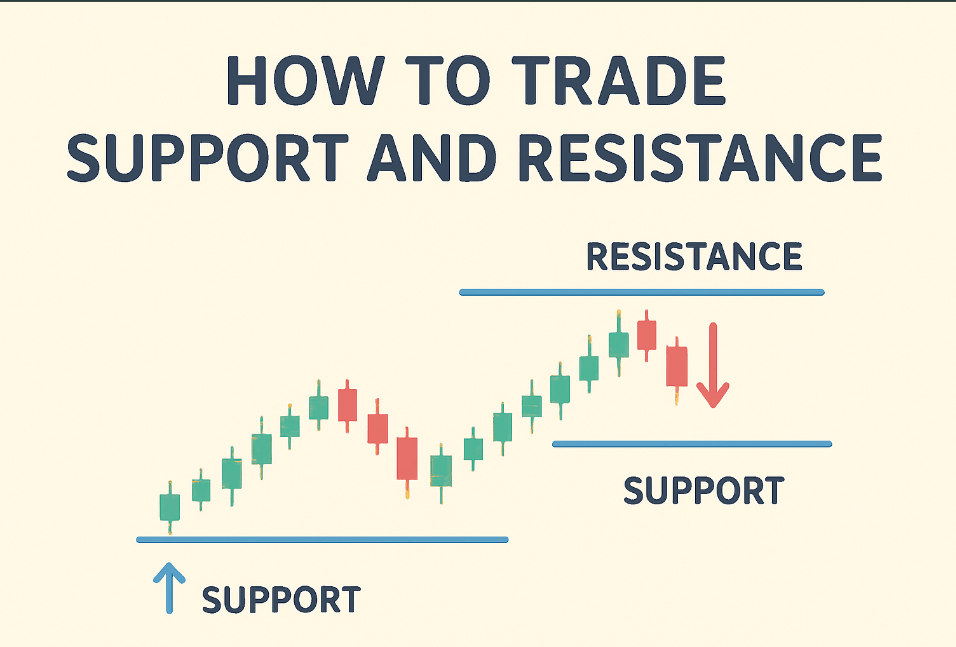
Understanding Support and Resistance
Support is a price level where a currency pair tends to stop falling due to increased buying interest, acting like a “floor.” Resistance is a level where upward price movement stalls due to selling pressure, functioning as a “ceiling.” These levels form because of market psychology, traders remember past price points where reversals occurred, influencing future actions.
For example, if USD/JPY consistently bounces from 145.00, that’s a support level. If it struggles to break 150.00, that’s resistance. Trading these levels involves anticipating price reactions and positioning accordingly.
Why Trade Support and Resistance?
Trading support and resistance offers several advantages:
- Clear Entry/Exit Points: Buy near support, sell near resistance, or trade breakouts.
- Effective Risk Management: Place stop-losses just beyond these levels to limit losses.
- Versatility: Works across forex pairs, timeframes, and other markets like stocks or crypto.
- High Probability Setups: Historical levels often repeat, improving trade accuracy.
Studies show that strategies leveraging support and resistance can increase win rates by 15-20% when combined with proper confirmation tools.
Step-by-Step Guide to Trading Support and Resistance
1. Identify Key Levels
Use historical price data to spot support and resistance:
- Historical Highs/Lows: Look for price points where the market repeatedly reverses.
- Round Numbers: Psychological levels like 1.2000 for EUR/USD often act as barriers.
- Fibonacci Retracements: Levels like 38.2% or 61.8% can highlight potential zones.
- Moving Averages: The 50-day or 200-day moving averages often serve as dynamic support/resistance.
Pro Tip: Use charting platforms like TradingView or MetaTrader 4 to mark these levels accurately.
2. Confirm the Levels
Ensure the level is significant:
- Multiple Touches: A level with three or more price reversals is stronger.
- Volume Spikes: Higher trading volume at a level indicates strong buyer/seller interest.
- Candlestick Patterns: Look for patterns like pin bars or engulfing candles to confirm reversals.
For example, if GBP/USD approaches a support at 1.2500 with a bullish pin bar and rising volume, it’s a strong buy signal.
3. Choose a Trading Strategy
There are three primary ways to trade support and resistance:
- Bounce Trading: Buy at support or sell at resistance, expecting a reversal.
- Example: Buy EUR/USD at a support of 1.0800, targeting a move to 1.0900, with a stop-loss at 1.0770.
- Breakout Trading: Trade when price breaks through a level with strong momentum.
- Example: If USD/CAD breaks above resistance at 1.3800 with high volume, buy targeting 1.3900.
- Range Trading: Trade between support and resistance in a sideways market.
- Example: Buy AUD/USD at support (0.6600) and sell at resistance (0.6800) in a horizontal range.
4. Set Stop-Loss and Take-Profit
- Stop-Loss: Place just below support (for buys) or above resistance (for sells) to protect against false breaks. A common rule is 10-20 pips beyond the level.
- Take-Profit: Target the next significant level or use a risk-reward ratio (e.g., 1:2).
5. Use Confirmation Indicators
Combine with indicators for better accuracy:
- RSI (Relative Strength Index): Look for oversold conditions near support or overbought near resistance.
- MACD: Confirm trend strength or reversals at key levels.
- Volume: Ensure breakouts or bounces have strong volume backing.
6. Monitor and Adjust
Markets evolve, so re-evaluate levels regularly:
- Role Reversal: Broken support can become resistance, and vice versa.
- News Events: Economic data like interest rate decisions can disrupt levels.
- Timeframes: Confirm levels across multiple timeframes (e.g., daily and 4-hour) for robustness.
Real-World Example
In mid-2025, EUR/USD formed a strong support at 1.0700, with multiple bounces on the daily chart. Traders bought at this level, setting a stop-loss at 1.0670 and targeting resistance at 1.0900, yielding a 200-pip profit. When the price later broke above 1.0900 with strong volume, breakout traders entered long positions, riding the trend to 1.1100.
Common Mistakes to Avoid
- Overloading Charts: Too many levels cause confusion. Focus on the most prominent ones.
- Ignoring False Breakouts: Use volume and candlestick confirmation to avoid traps.
- Neglecting Fundamentals: News like Non-Farm Payrolls can invalidate technical levels.
- Poor Risk Management: Always use stop-losses to protect capital.
- Forcing Trades: Don’t trade weak levels with few historical touches.
5 Tips for Trading Support and Resistance
- Multi-Timeframe Analysis: Confirm levels on higher timeframes (e.g., weekly) for stronger signals.
- Zone Thinking: Treat support/resistance as zones (e.g., 1.1990-1.2010) rather than exact prices.
- Combine with Trend Lines: Use trend lines to identify dynamic support/resistance within trends.
- Set Alerts: Platforms like TradingView can notify you when price nears key levels.
- Backtest Strategies: Test your approach on historical data to refine entry/exit rules.
Trading support and resistance is a skill that can transform your forex trading by providing clear, high-probability setups. By identifying key levels, using confirmation tools, and applying disciplined risk management, you can trade bounces, breakouts, or ranges with confidence. Practice on a demo account, refine your strategy, and start leveraging these levels to unlock consistent profits in the forex market.
Frequently Asked Questions
How do I identify strong support and resistance levels?
- Look for price levels with multiple historical touches, high trading volume, and confirmation from candlestick patterns or indicators like Fibonacci retracements.
What’s the best strategy for trading support and resistance?
- Common strategies include bounce trading (buying at support, selling at resistance), breakout trading (trading level breaks), and range trading (buying low, selling high in a range).
Can support become resistance after a breakout?
- Yes, once a support level is broken, it often becomes resistance on future rallies. Similarly, broken resistance can turn into support.
How do I avoid false breakouts when trading these levels?
- Confirm breakouts with high volume, strong candlestick patterns (e.g., engulfing candles), and indicators like RSI or MACD to filter out false signals.
Are support and resistance effective in volatile forex markets?
- Yes, but volatility from news events (e.g., central bank announcements) can disrupt levels. Always use stop-losses and monitor economic calendars to manage risk.

