


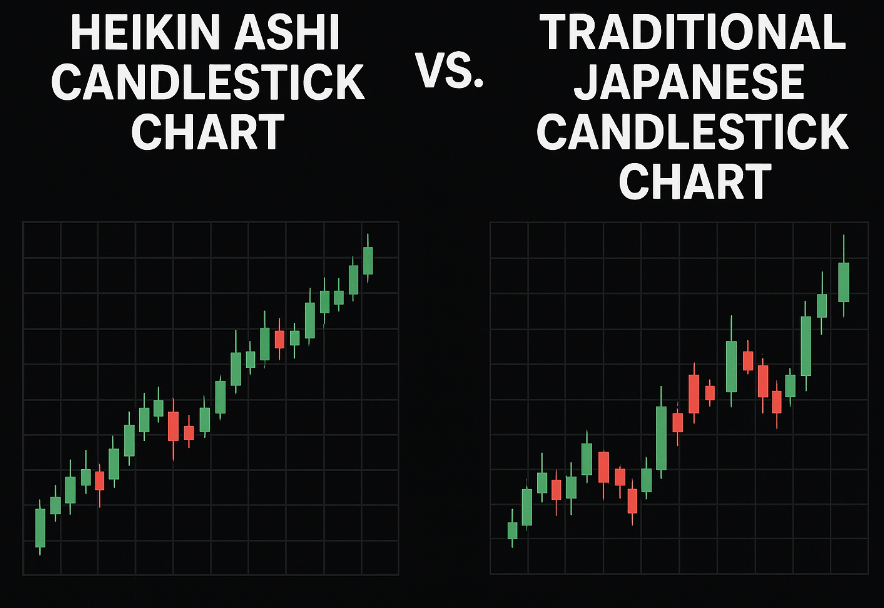
In this article you’re going to know the key differences between the Heikin Ashi Candlestick Chart vs. Traditional Japanese Candlestick Chart. Choosing the right chart type is the first critical decision a trader makes. While Traditional Japanese Candlesticks are the foundation of technical analysis, the Heikin Ashi (HA) method offers a completely different, often more straightforward, view of the market.
These two charting techniques look similar, but their underlying calculations and visual interpretations are drastically different. Understanding their differences will help you decide whether you need the raw precision of Traditional candles or the smoothed clarity of Heikin Ashi for your trading style.
In This Post
The Core Difference: Calculation and Market Truth
The fundamental distinction between the two lies in what they represent: Traditional candlesticks show the exact price action, while Heikin Ashi shows the average price action over a period.
Traditional Japanese Candlesticks
The traditional method plots the four key prices—Open, High, Low, and Close (OHLC) for a specific time period (e.g., 1 hour, 1 day). These candles use the raw, unfiltered price data for the period, meaning:
- The Open Price is the exact price at which the period started.
- The Close Price is the exact last price traded in the period.
Traditional candles show every ounce of market volatility, including gaps (where a new period opens higher or lower than the previous close) and sharp wicks (showing failed attempts by bulls or bears). This is the raw truth of the market.
Heikin Ashi Candlesticks
The Heikin Ashi method calculates an average price for each element, relying on data from both the current period and the previous HA candle. This averaging process is the key to smoothing out the visual noise.
- The HA Open is derived from the average of the previous HA Open and previous HA Close, which is why the candles appear visually connected.
- The HA Close is the average of the current period’s standard OHLC.
Heikin Ashi charts provide a filtered view of the market’s momentum. Because of the averaging, Heikin Ashi charts frequently eliminate price gaps and short-term volatility, making trends appear much cleaner and longer-lasting.
Visual Comparison: Noise, Clarity, and Trend Strength
The way each chart presents trends, volatility, and reversal signals is the most important practical difference for traders.
Clarity vs. Noise
Traditional charts often appear choppy, displaying many changes in color and long wicks as price oscillates. This reflects the market’s minute-by-minute volatility. In contrast, Heikin Ashi charts are very smooth, showing long strings of the same color (green for up, red for down). This smoothing makes trends instantly recognizable, as minor pullbacks that would change a Traditional candle’s color are often absorbed by the HA averaging mechanism.
Gaps and Precision
A critical point is how the charts handle price gaps. On Traditional charts, gaps are visible and serve as powerful technical signals of conviction or news events. Because the HA Open price is calculated from the previous HA bar’s average, gaps are usually eliminated on Heikin Ashi charts, thereby obscuring a key piece of price data. This makes Traditional candles superior for traders who rely on precise entry and exit points.
Identifying Strong Momentum
Heikin Ashi offers a uniquely clear signal for strong momentum:
- A strong HA uptrend is signaled by a series of green candles that have NO lower shadow (or wick). This confirms that sellers had minimal to zero control during that period.
- A strong HA downtrend is indicated by continuous red candles that have NO upper shadow.
While Traditional charts signal strength with consistently high closes and small lower wicks (in an uptrend), the Heikin Ashi rules provide a simpler, more definitive visual confirmation of conviction.
Spotting Indecision and Reversals
Both charts use small bodies and long shadows to signal market indecision. On Traditional charts, this can manifest as a Doji or Spinning Top. On Heikin Ashi, the appearance of a small body with long shadows on both sides is a strong warning that the trend is losing steam and a potential reversal is imminent. A color flip (green to red or vice versa) following this pattern is the trigger for reversal confirmation.
Trade-offs: Speed vs. Accuracy
Choosing between the two involves a classic trading trade-off: Do you prioritize the speed and precision required for immediate execution, or the clarity and endurance required for riding a trend?
- Use Traditional Candlesticks when you require precise entry and exit prices. They are essential for scalping, day trading, and confirming exact support/resistance and classic candlestick patterns (like Engulfing or Hammer).
- Use Heikin Ashi when your goal is trend following or noise reduction. They are superior for swing traders who want to filter out short-term volatility and remain in profitable trades longer by focusing on sustained momentum.
Many professional traders utilize both: they check the Heikin Ashi chart on a higher timeframe (e.g., 4-hour) to confirm the overall trend and momentum, and then use the Traditional chart on a lower timeframe (e.g., 5-minute) to pinpoint the best entry and stop-loss placements.
Frequently Asked Questions (FAQs)
Which chart type gives me the real market price?
- Traditional Japanese Candlesticks show the real, actual market price for the Open, High, Low, and Close. The prices shown on the Heikin Ashi chart are averages and do not necessarily correspond to the price at which you can execute a trade.
Does Heikin Ashi remove the lag often seen in indicators?
- No, in fact, Heikin Ashi can introduce a slight lag. Because its calculation relies on the previous candle’s data, it is a smoothing tool. This means that a reversal is often confirmed on the HA chart slightly after it has already started on the Traditional chart.
Can I use Heikin Ashi for candlestick patterns like the “Doji” or “Hammer”?
- While Heikin Ashi candles can display patterns (like a small body with long shadows, signaling indecision), you should not interpret them as the classic Japanese candlestick patterns. The raw price structure required for a true Engulfing or Hammer pattern is only visible on the Traditional chart.
Why do Heikin Ashi charts show fewer gaps than Traditional charts?
- Gaps are minimized because the HA Open price is calculated as the average of the previous HA bar, meaning the current bar opens near the middle of the previous one. Traditional charts, however, open at the true market price, which can jump (gap) significantly from the previous close.





