


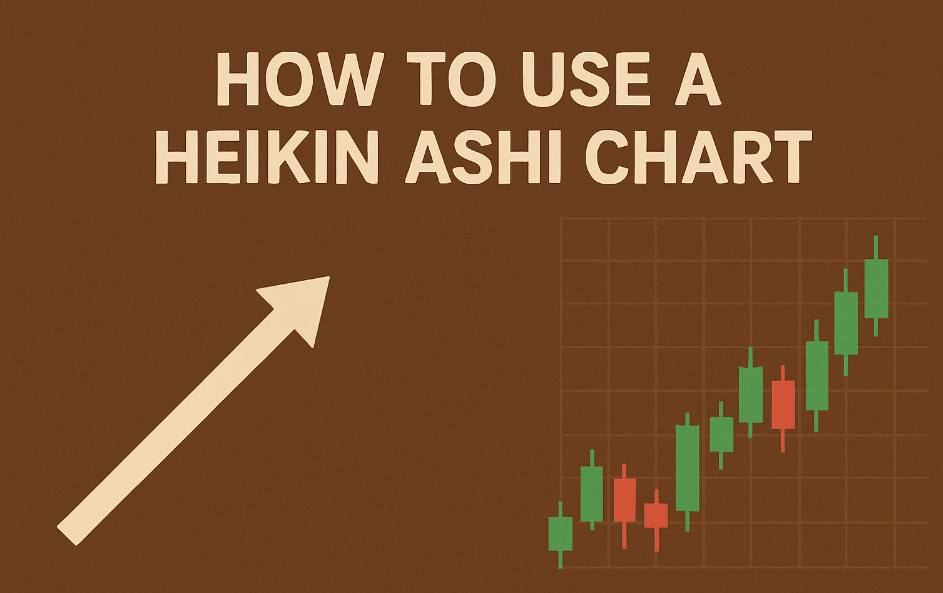
Heikin Ashi (HA) charts are a powerful technical tool designed to filter out market noise and clearly highlight the underlying trend. Unlike Traditional Japanese Candlesticks, which show every fluctuation, HA charts simplify the visual representation of momentum, making entry and exit signals much clearer for trend-following strategies.
In This Post
Identifying and Confirming a Strong Trend
The primary use of Heikin Ashi is to confirm and ride sustained market momentum. The candles use a simple color-coding system to indicate the market’s conviction.
Strong Uptrend Confirmation (Bullish Signal)
A strong uptrend is confirmed by a sequence of green (or hollow) HA candles that have no lower shadow (wick).
- Interpretation: The absence of a lower wick means the average price never traded below the open of the HA candle. This confirms that buyers were in control from the moment the candle “opened” to its close, signaling high momentum and conviction.
- Actionable Signal: This is the ideal time to hold a long position or look for an entry signal if you’re not already in the trade.
Strong Downtrend Confirmation (Bearish Signal)
A strong downtrend is confirmed by a sequence of red (or filled) HA candles that have no upper shadow (wick).
- Interpretation: The lack of an upper wick means the average price never traded above the open. This confirms that sellers maintained control throughout the period, signaling powerful downward momentum.
- Actionable Signal: This is the ideal time to hold a short position or look for an entry signal if you believe the trend will continue.
Recognizing Trend Weakness and Reversals
The first signs of a trend reversal appear visually on the Heikin Ashi chart as changes in the shadow (wick) length and, critically, a change in color.
Signals of Indecision and Momentum Loss
When a trend starts to slow, the HA candles begin to show shadows (wicks) on both sides (upper and lower).
- Interpretation: The appearance of wicks on both sides, especially when the candle body is small, indicates market indecision and a loss of momentum. Buyers and sellers are now balanced, and the preceding trend is pausing or preparing to reverse.
- Actionable Signal: If you are holding a position, this is your first warning sign to tighten your stop-loss or consider taking partial profits.
Confirmation of Trend Reversal
The actual reversal signal is a color change following a period of indecision.
- Uptrend Reversal: The transition from green HA candles to a red HA candle (especially one with a small body and a long upper wick) confirms that control has shifted to the sellers.
- Downtrend Reversal: The transition from red HA candles to a green HA candle (especially one with a small body and a long lower wick) confirms that control has shifted to the buyers.
- Actionable Signal: A confirmed color flip is often used as a signal to exit the previous trade and potentially enter a trade in the opposite direction.
Combining Heikin Ashi with Other Indicators
While HA is powerful on its own, it works best when paired with an indicator that measures overbought/oversold conditions or volume.
- HA and RSI/Stochastics (Momentum Confirmation):
- Use the Relative Strength Index (RSI) or Stochastic Oscillator to identify when a market is overbought (high 70s or 80s) or oversold (low 20s or 30s).
- Trade Confirmation: Do not trade based on RSI alone. Wait for the HA chart to show its reversal signal (small body, wicks on both sides, and a color flip) after the market has hit an extreme RSI reading. This dramatically increases the probability of a successful reversal trade.
- HA and Moving Averages (Dynamic Support/Resistance):
- Plot one or two Moving Averages (MAs), such as the 20-period Exponential Moving Average (EMA).
- Entry/Exit: In a strong HA uptrend, a pullback to the MA is healthy. Wait for the HA candles to touch the MA and then turn back up, showing a strong green body with no lower wick. This confirms the MA held as support and is an ideal entry point.
Frequently Asked Questions (FAQs)
Can I use Heikin Ashi to find exact support and resistance levels?
- No, it is not recommended. Because the HA candle prices are calculated averages, they are visually misleading when plotting precise support and resistance lines. Always use the Traditional Japanese Candlesticks on the same chart to accurately identify and plot significant price levels.
Is Heikin Ashi better for day trading or swing trading?
- Heikin Ashi is better suited for swing trading and long-term position trading where the goal is to ride a trend for days or weeks. For day trading and scalping, which require high precision and fast execution, the lag introduced by the HA averaging can cause missed opportunities or poor entry prices.
Does Heikin Ashi eliminate market noise?
- Yes, that is its primary function. By averaging the Open and Close prices, it minimizes the rapid, choppy fluctuations seen on traditional charts. This filtering effect simplifies the visual presentation of price action, allowing you to focus purely on the sustained direction of the trend.
What is the most important Heikin Ashi signal?
- The most reliable and powerful signal is the absence of a shadow in the direction opposite to the trend (e.g., green candles with no lower wick in an uptrend). This shows overwhelming conviction and minimal pushback from the opposing side.
If my HA candle is green, does that mean the price closed higher than the previous period’s close?
- Not necessarily. Unlike Traditional charts, where a green candle means the Close > Open, a green HA candle only means the average price is moving higher. Due to the averaging calculation, it is possible for a green HA candle to form even if the actual market price closed slightly lower than the previous period’s actual close. This is the key trade-off you accept for the sake of noise reduction.





