


The Gartley pattern (also called “Gartley 222”) is the original and most respected harmonic price pattern in technical analysis. First published by H.M. Gartley in his 1935 book Profits in the Stock Market, it uses precise Fibonacci ratios to identify high-probability reversal zones with excellent risk-reward. Today, forex, stocks, and crypto traders rely on the Gartley for clean setups on EUR/USD, GBP/JPY, NAS100, and Bitcoin.
This complete guide explains what the Gartley pattern is, bullish vs bearish versions, exact Fibonacci rules, identification steps, trading strategies, and real-world examples.
In This Post
What is the Gartley Pattern?
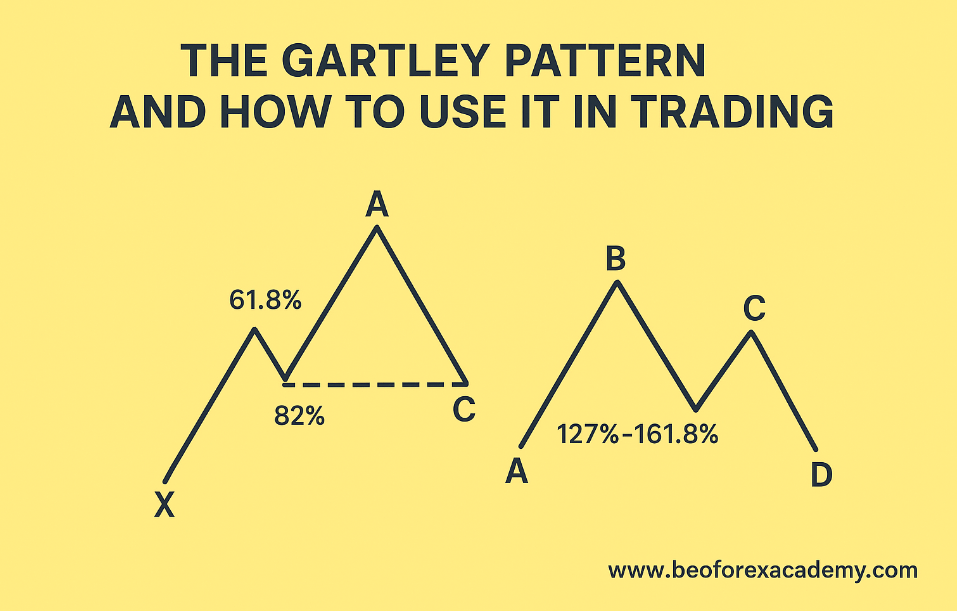
The Gartley is a 5-point (X-A-B-C-D) retracement pattern that signals a trend reversal when price reaches the Potential Reversal Zone (PRZ) at point D.
- Bullish Gartley: Forms at market bottoms → buy at D
- Bearish Gartley: Forms at market tops → sell/short at D
It is the foundation for all other harmonic patterns (Bat, Butterfly, Crab, etc.).
Exact Fibonacci Rules for a Valid Gartley Pattern
All ratios must be met within a small tolerance (usually ±1–2%):
Bullish and Bearish Gartley Retracement/Extension
- AB leg: 61.8% of XA
- BC leg: 38.2% – 88.6% of AB
- CD leg: 78.6% retracement of XA
- BD leg: 127.2% – 161.8% extension of BC
The strongest Gartleys have multiple Fibonacci confluence at point D.
How to Identify the Gartley Pattern (Step-by-Step)
- Find a strong impulse move → label as X to A
- Wait for retracement → point B at exactly 61.8% of XA
- Price rallies/falls again → point C at 38.2–88.6% of AB
- Final leg → point D completes at 78.6% of XA + 127–161.8% extension of BC
- Confirm PRZ confluence and reversal candle
Use harmonic indicators (ZUP, Harmony) or manual Fibonacci tools on TradingView/MT4.
Bullish vs Bearish Gartley – Key Differences
Bullish Gartley (M-shape reversed):
- XA is down
- D is below X
- Buy the bottom
Bearish Gartley (W-shape reversed):
- XA is up
- D is above X
- Sell/short the top
Both require the same 61.8% AB retracement, that’s the signature ratio.
How to Trade the Gartley Pattern
Entry Rules
- Wait for price to reach D (PRZ)
- Confirm with bullish/bearish reversal candle (pin bar, engulfing)
- Additional confluence: RSI divergence, support/resistance, 200 EMA
Risk Management
- Stop-loss: 5–20 pips beyond X (or just past D extension)
- Invalidation: If price closes past X → pattern fails
Take-Profit Targets
- TP1: 38.2% retracement of CD
- TP2: 61.8% retracement of CD (point C)
- TP3: 100% or point A (aggressive)
Average risk-reward = 1:3 to 1:5
Real-World Example: Bullish Gartley on EUR/USD (2024)
- X: 1.1200 (high)
- A: 1.0600
- B: 1.0909 (exact 61.8%)
- C: 1.0700
- D: 1.0630 (78.6% XA + 161.8% BC)
→ Price reversed from 1.0630 rallied 600+ pips to 1.1270
Advantages and Limitations of the Gartley Pattern
Advantages
- Extremely high accuracy when rules are followed
- Precise entry/stop levels
- Works on all markets and timeframes (H1–Daily best)
Limitations
- Requires exact ratios — many “near-misses” fail
- Fewer valid setups than classic patterns
- Can be subjective without good tools
The Gartley pattern remains one of the most reliable harmonic setups because of its strict 61.8% AB retracement rule and strong PRZ confluence. Focus on clean X-A impulses, wait patiently for point D, and always confirm with price action. Combine with volume or RSI divergence for 70%+ win rates. Start scanning major pairs today, once you see your first perfect Gartley, you’ll never trade without harmonics the same way again.
Frequently Asked Questions
Is the Gartley pattern the most accurate harmonic pattern?
- Yes, many professional harmonic traders consider the classic Gartley the most reliable due to its conservative 78.6% D completion.
What is the difference between Gartley and Bat patterns?
- Gartley uses 78.6% at D; Bat uses tighter 88.6%. Bat is more aggressive and appears more often.
Can I trade Gartley on lower timeframes?
- Yes, but H4 and Daily give the cleanest, highest-probability setups. M15–H1 have more false signals.
What invalidates a Gartley pattern?
- Price closing beyond point X or failing the 61.8% AB retracement rule.
Should I use indicators to find Gartley patterns?
- Yes, tools like ZUP, Harmonic Dashboard, or TradingView scripts save hours and reduce subjectivity. Always verify manually.





