


Chart patterns form the bedrock of technical analysis, offering visual representations of the forces of supply and demand. These patterns provide crucial clues about where the market has been, where it is now, and, most importantly, the probability of its future direction.
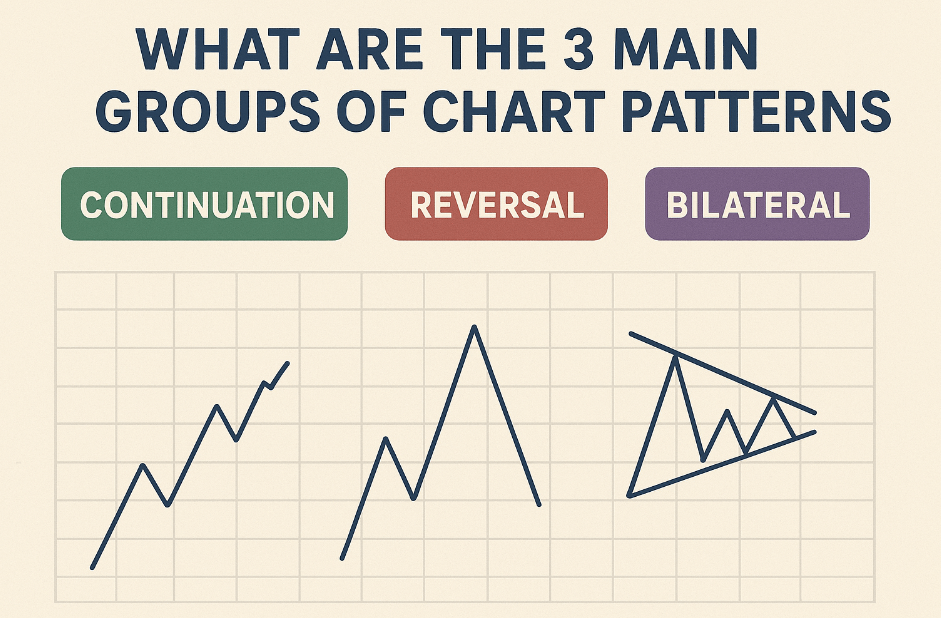
While hundreds of variations exist, technical analysts categorize them into three fundamental groups based on the signal they provide regarding the prevailing market trend: Reversal, Continuation, and Consolidation (or Bilateral) Patterns.
In This Post
Reversal Chart Patterns: Signaling a Trend Change
Reversal patterns are the most critical group, as they signal that the current trend is exhausted and is highly likely to change direction. For instance, an uptrend may transition into a downtrend, or a downtrend may transition into an uptrend.
Key Characteristics:
- Trend Status: Always appear at the end of a prolonged trend (either bullish or bearish).
- Confirmation: Confirmation of a successful reversal requires a break of a key support or resistance level (the “neckline”).
- Trading Implication: Initiate a trade in the opposite direction of the previous trend.
Common Reversal Patterns:
- Head and Shoulders (H&S): The most iconic reversal pattern, typically seen at the top of an uptrend. It features three peaks (a higher central peak, the “head,” flanked by two lower peaks, the “shoulders”).
- Double Top & Double Bottom: Indicate two failed attempts by the price to break a key resistance (top) or support (bottom) level, suggesting a decisive turn.
- Triple Top & Triple Bottom: Similar to the double patterns but show three failed attempts, often signaling a stronger reversal.
Continuation Chart Patterns: Confirming Trend Momentum
Continuation patterns are temporary pauses in the market’s movement. They signal that the dominant trend is merely resting or consolidating strength before resuming its original direction. These patterns offer high-probability setups, as they trade with the underlying momentum.
Key Characteristics:
- Trend Status: Occur during the middle of a strong trend (interrupting a rally or a decline).
- Duration: Typically shorter in duration and smaller in magnitude than reversal patterns.
- Trading Implication: Initiate a trade in the same direction as the existing trend once the pattern boundary is broken.
Common Continuation Patterns:
- Flags and Pennants: These are short-term, small-scale consolidation shapes (a small rectangle or a small triangle) that form after a sharp, impulsive move (the “flagpole”). They signal a brief profit-taking phase before the main trend continues.
- Triangles (Ascending and Descending): These two types of triangles have a directional bias and usually continue the underlying trend. Ascending (bullish bias) often appears in uptrends, and Descending (bearish bias) often appears in downtrends.
Consolidation and Bilateral Patterns: Waiting for Direction
The third group of patterns signifies indecision or consolidation where buyers and sellers are in a near-perfect balance. These patterns are often referred to as Bilateral because the breakout can occur in either direction.
Key Characteristics:
- Trend Status: Represents a period of decreasing volatility and tightening price range.
- Confirmation: Requires strict adherence to breakout rules, as the direction is unpredictable.
- Trading Implication: Traders must wait for a clear, confirmed breakout (usually with high volume) to dictate the trade direction.
Common Consolidation Patterns:
- Rectangles (or Boxes): Formed when the price bounces consistently between two parallel horizontal lines of support and resistance. The trend is temporarily boxed in.
- Symmetrical Triangles: Formed by two converging lines, one sloping up and one sloping down. This signifies equal pressure from buyers and sellers, leaving the eventual breakout direction entirely dependent on future volume and market news.
- Wedges (Contracting): While sometimes reversal patterns, they often function as complex consolidation zones that can break out either up or down.
Frequently Asked Questions
Which group of patterns is the most reliable for traders?
- Continuation patterns, such as Flags and Pennants, are often considered the most reliable because trading with the established trend carries higher probability. However, Reversal patterns offer the highest profit potential because they catch the beginning of a major new trend.
How important is volume when trading these patterns?
- Volume confirmation is critical. Regardless of the pattern group (Reversal, Continuation, or Consolidation), a valid breakout must be accompanied by a significant spike in trading volume. If the breakout occurs on low volume, it is much more likely to be a “false breakout” and quickly fail.
What is the main difference between an Ascending Triangle and a Symmetrical Triangle?
- The main difference is the directional bias. The Ascending Triangle has a flat top (horizontal resistance) which shows consistent buying pressure, giving it a bullish bias (a Continuation pattern). The Symmetrical Triangle has a downward sloping resistance and an upward sloping support, showing equal pressure, giving it a neutral/bilateral bias (a Consolidation pattern).
Should I trade immediately upon seeing a pattern complete?
- No. The best practice is to wait for a confirmed breakout—meaning a candle has closed decisively outside the pattern boundary. Even better, wait for a re-test where the price returns to touch the broken trend line (which now acts as the new support or resistance) before entering the trade. This adds an extra layer of confirmation.
Can a Continuation pattern fail and become a Reversal pattern?
- Yes, technical analysis is probabilistic, not absolute. If a Continuation pattern fails to break out in the trend direction and instead breaks out violently in the opposite direction, it effectively negates the continuation signal and can form the first phase of a larger Reversal pattern (such as a Double Top). This is why having a strict stop-loss is always mandatory.





