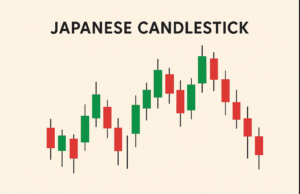
Japanese Candlestick Cheat Sheet
Modern technical analysis is based on Japanese candlesticks, which convert intricate pricing data into straightforward visual indicators of market psychology. They are the market’s language. The most potent and popular candlestick patterns are compiled in this cheat sheet according to